

An overview of the latest in the OASIS LMF (Loss Modeling Framework) platform and a new video in our gallery.
Over the past few years Mirai Solutions has been engaged in the development and maintenance of the front-end of the OASIS LMF (Loss Modeling Framework) platform. The web-browser application uses the R Shiny package to allow users to upload exposure data with locations, financial accounts information and reinsurance coverage. They can select and run a variety of NatCat models and visualize exposure and risks through maps, graphs, and numbers. The UI is constructed such that it can be operated by users with different levels of expertise ranging from industry, to insurance, to regular individuals.
A video showing all of major steps of the process can be found here and a description here.
The UI acts as an intermediary between users and the back-end OASIS API to easily and efficiently run analyses as well interact with maps and visualize results. To do so, the front-end covers a wide range of features including: uploading of csv and parquet files to run analyses, model customization, mapping (both interactive and static), and results shown with tables and graphs.
Files uploading
Uploading of files happens through the “Browse” button, which transfers data from the users’ local machines to the API:
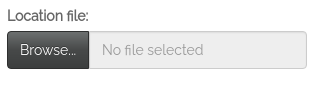
The UI accepts both csv and parquet extensions. Files contents can additionally be viewed by clicking on the “View” button 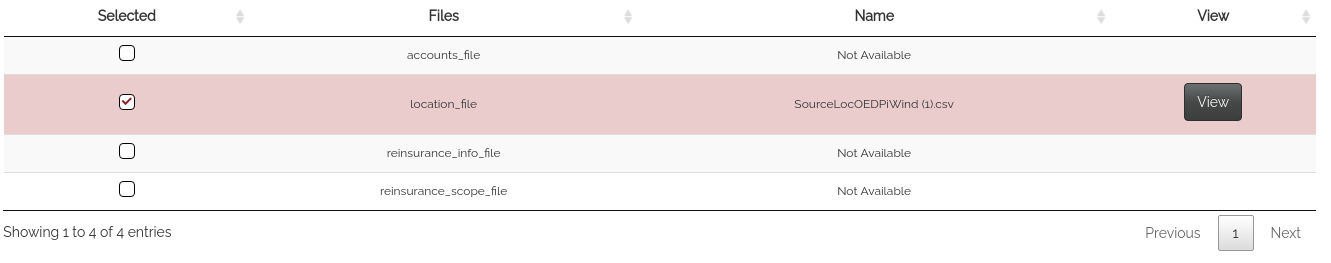
and selecting “Content”

4 categories of files are possible to upload: location, account, re-insurance info, and re-insurance scope. The only mandatory file is the location, which will be used in the following steps in order to create the analysis.
Model customization
An analysis is generated by associating files to a model. Both static and customizable models are available. The former does not allow changes within its settings and has to be accepted as is, whereas the latter lets the user edit its predefined settings. A customizable model was tasked by JBA in order to create a functionality to allow users to customize model settings instead of only selecting a predefined option. In order to access this option, a model has to include the customizable option. If this is the case, when a model is selected from the “Models” table, the “Customize Model” button is enabled and the settings can be modified in the table appearing below:
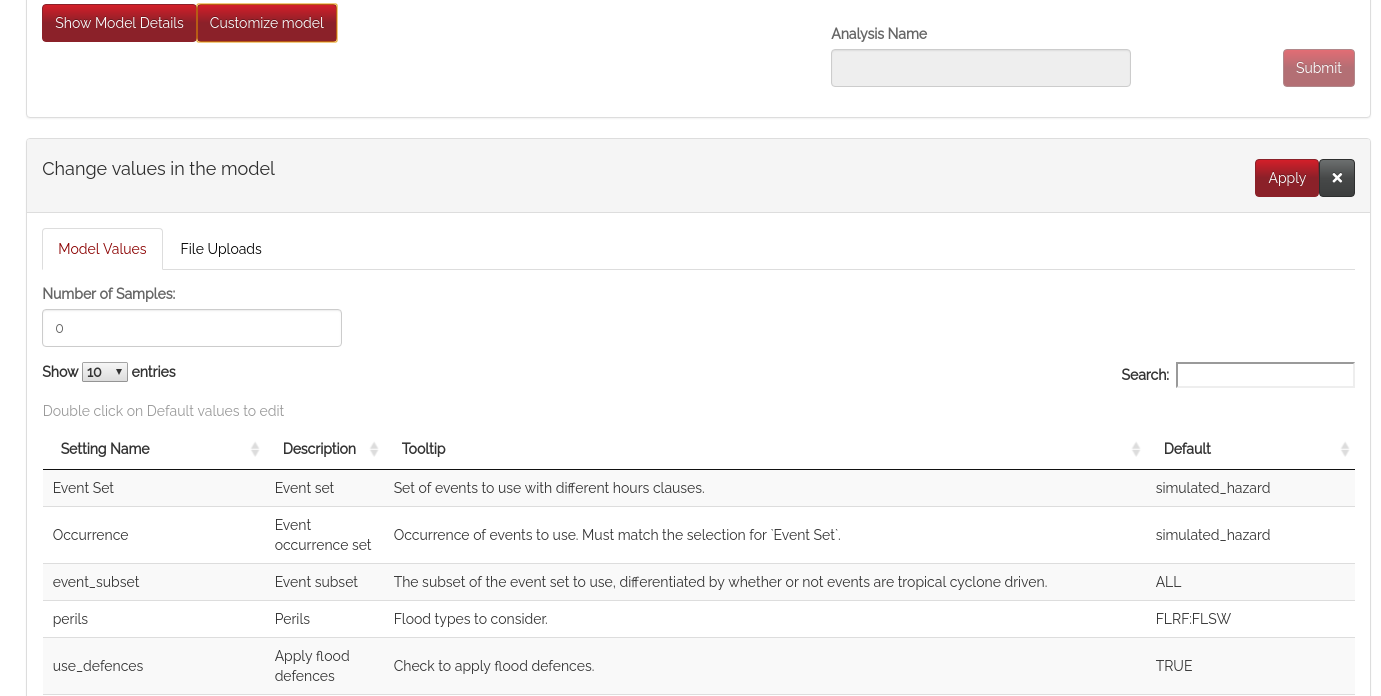
Modified values will also appear in the “Configure Output & Run” step to run an analysis.
Mapping
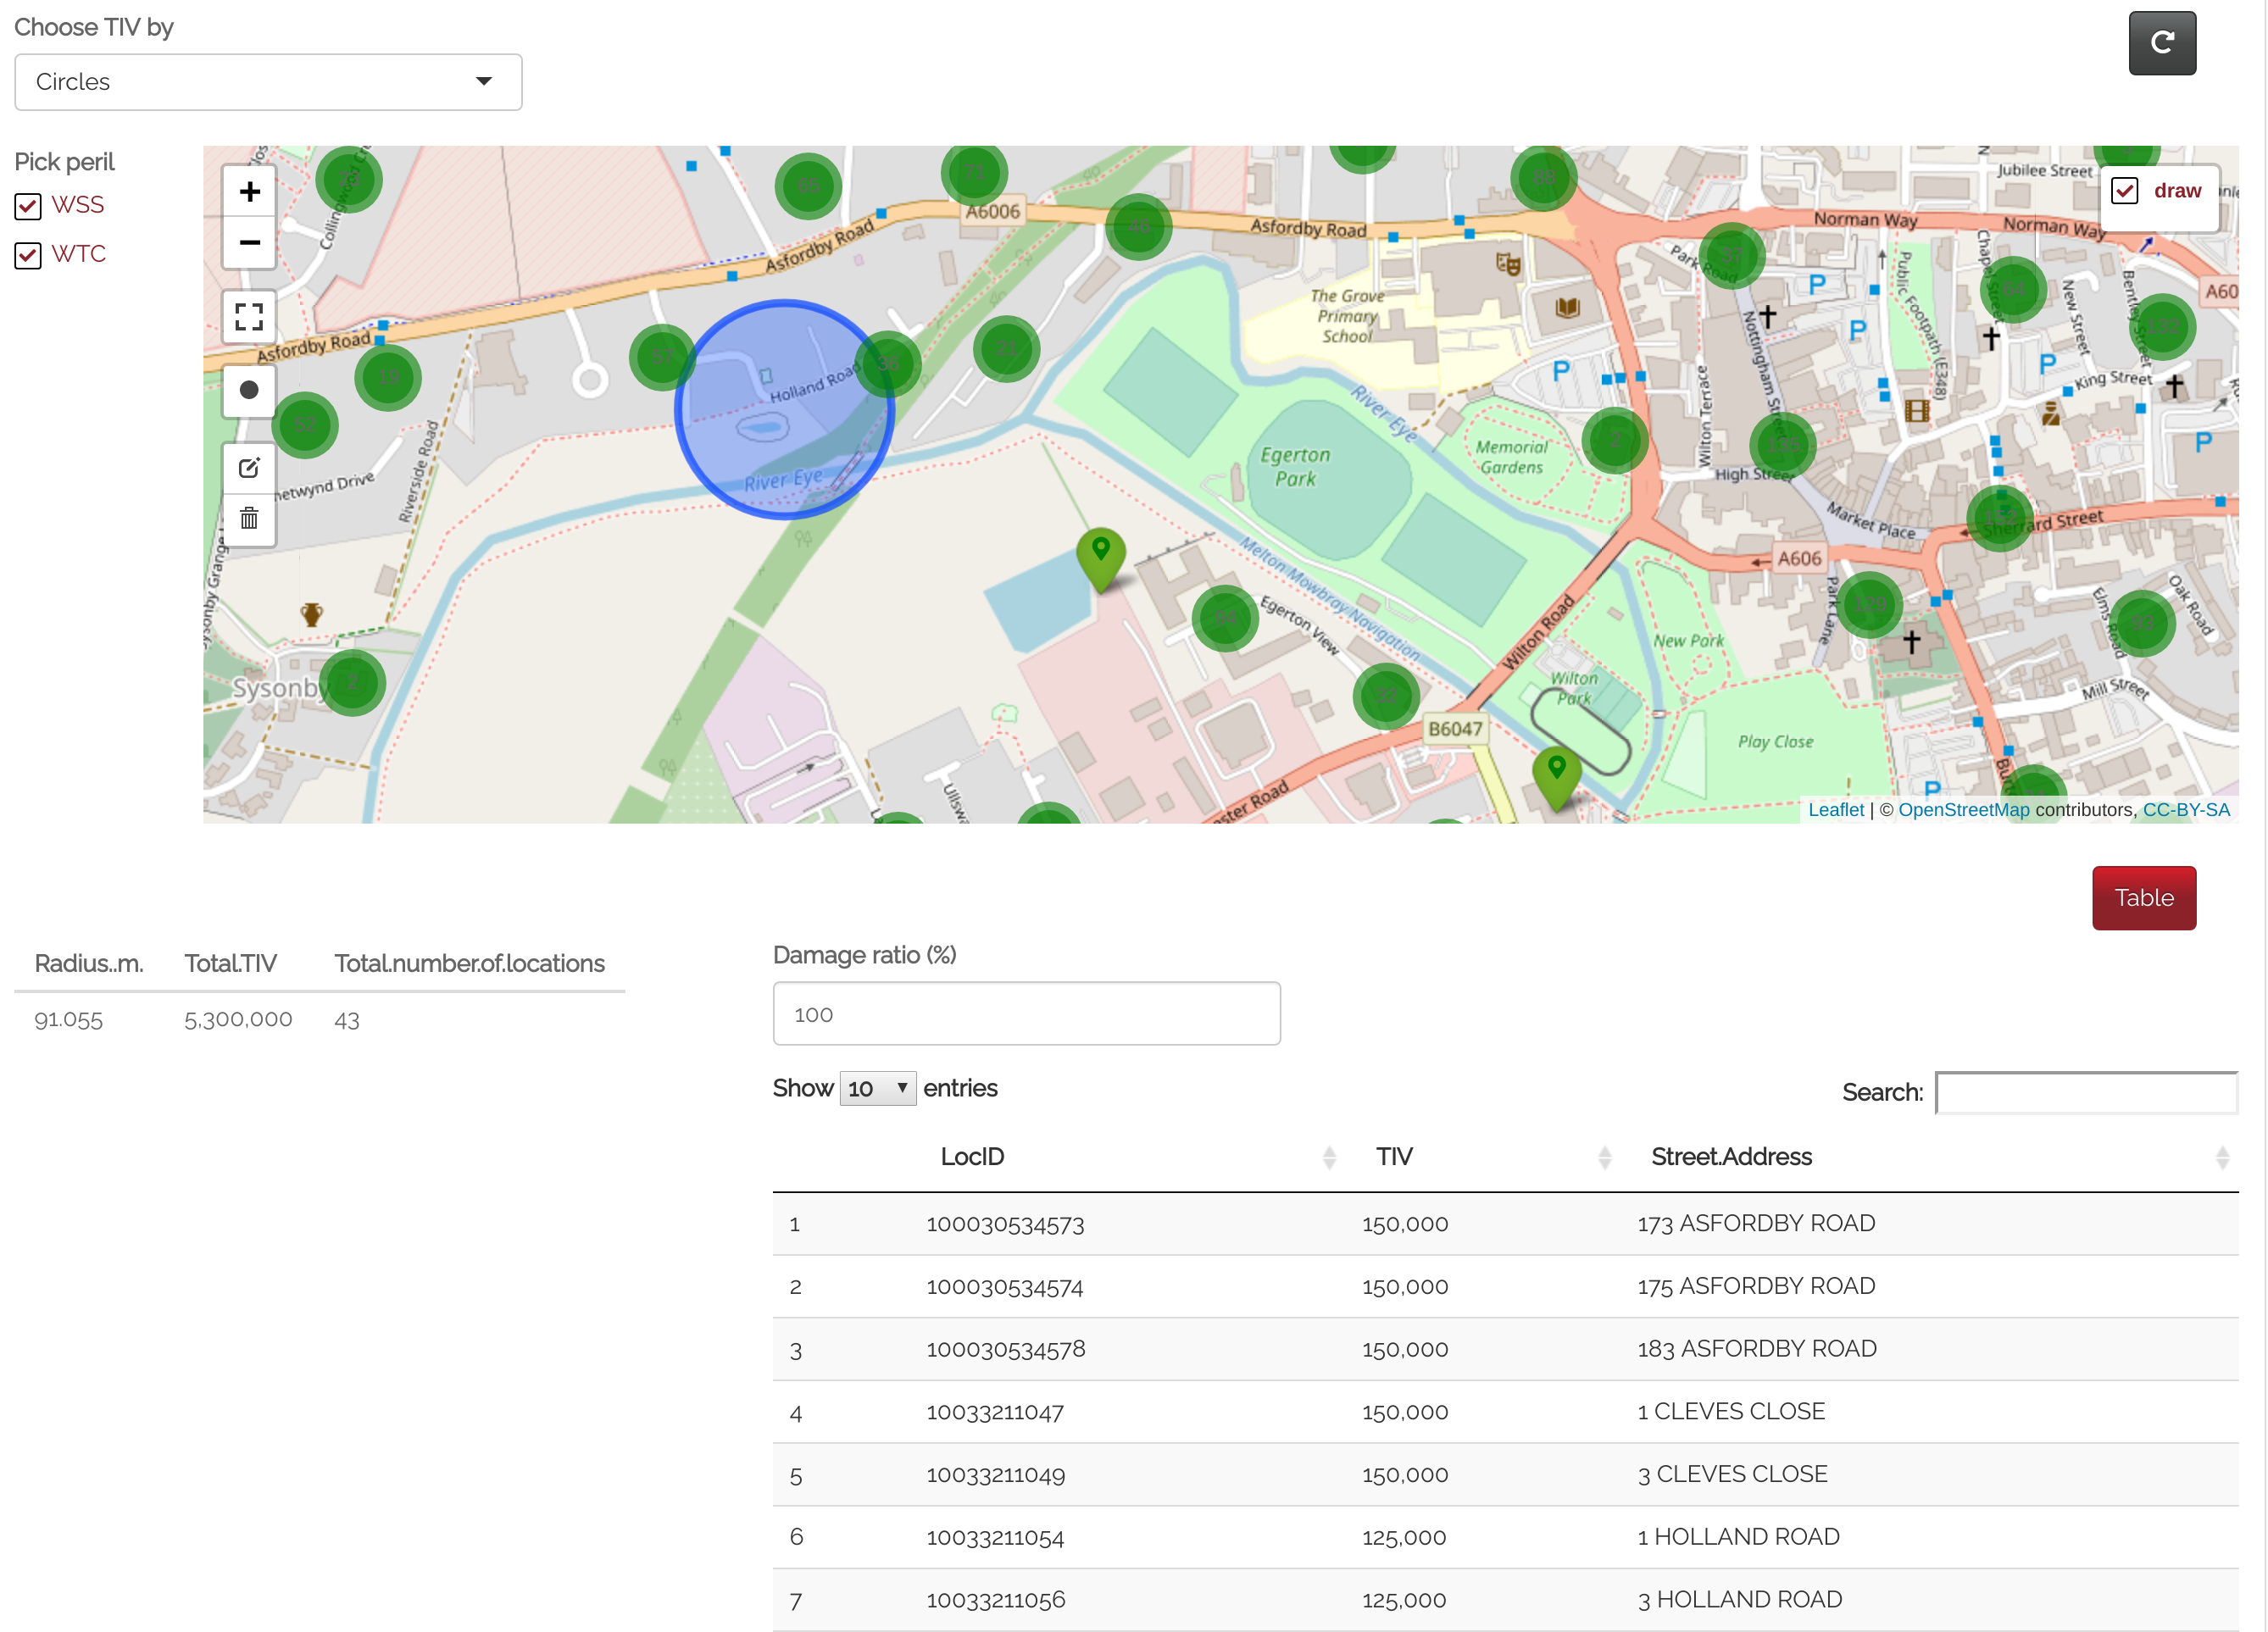
Maps are present throughout the UI in both static and interactive forms, both are created using the Leaflet package. They can be found in the steps “Choose Portfolio” and “Choose Analysis”. The “Validation Map” section of the latter allows users to directly interact with the map:
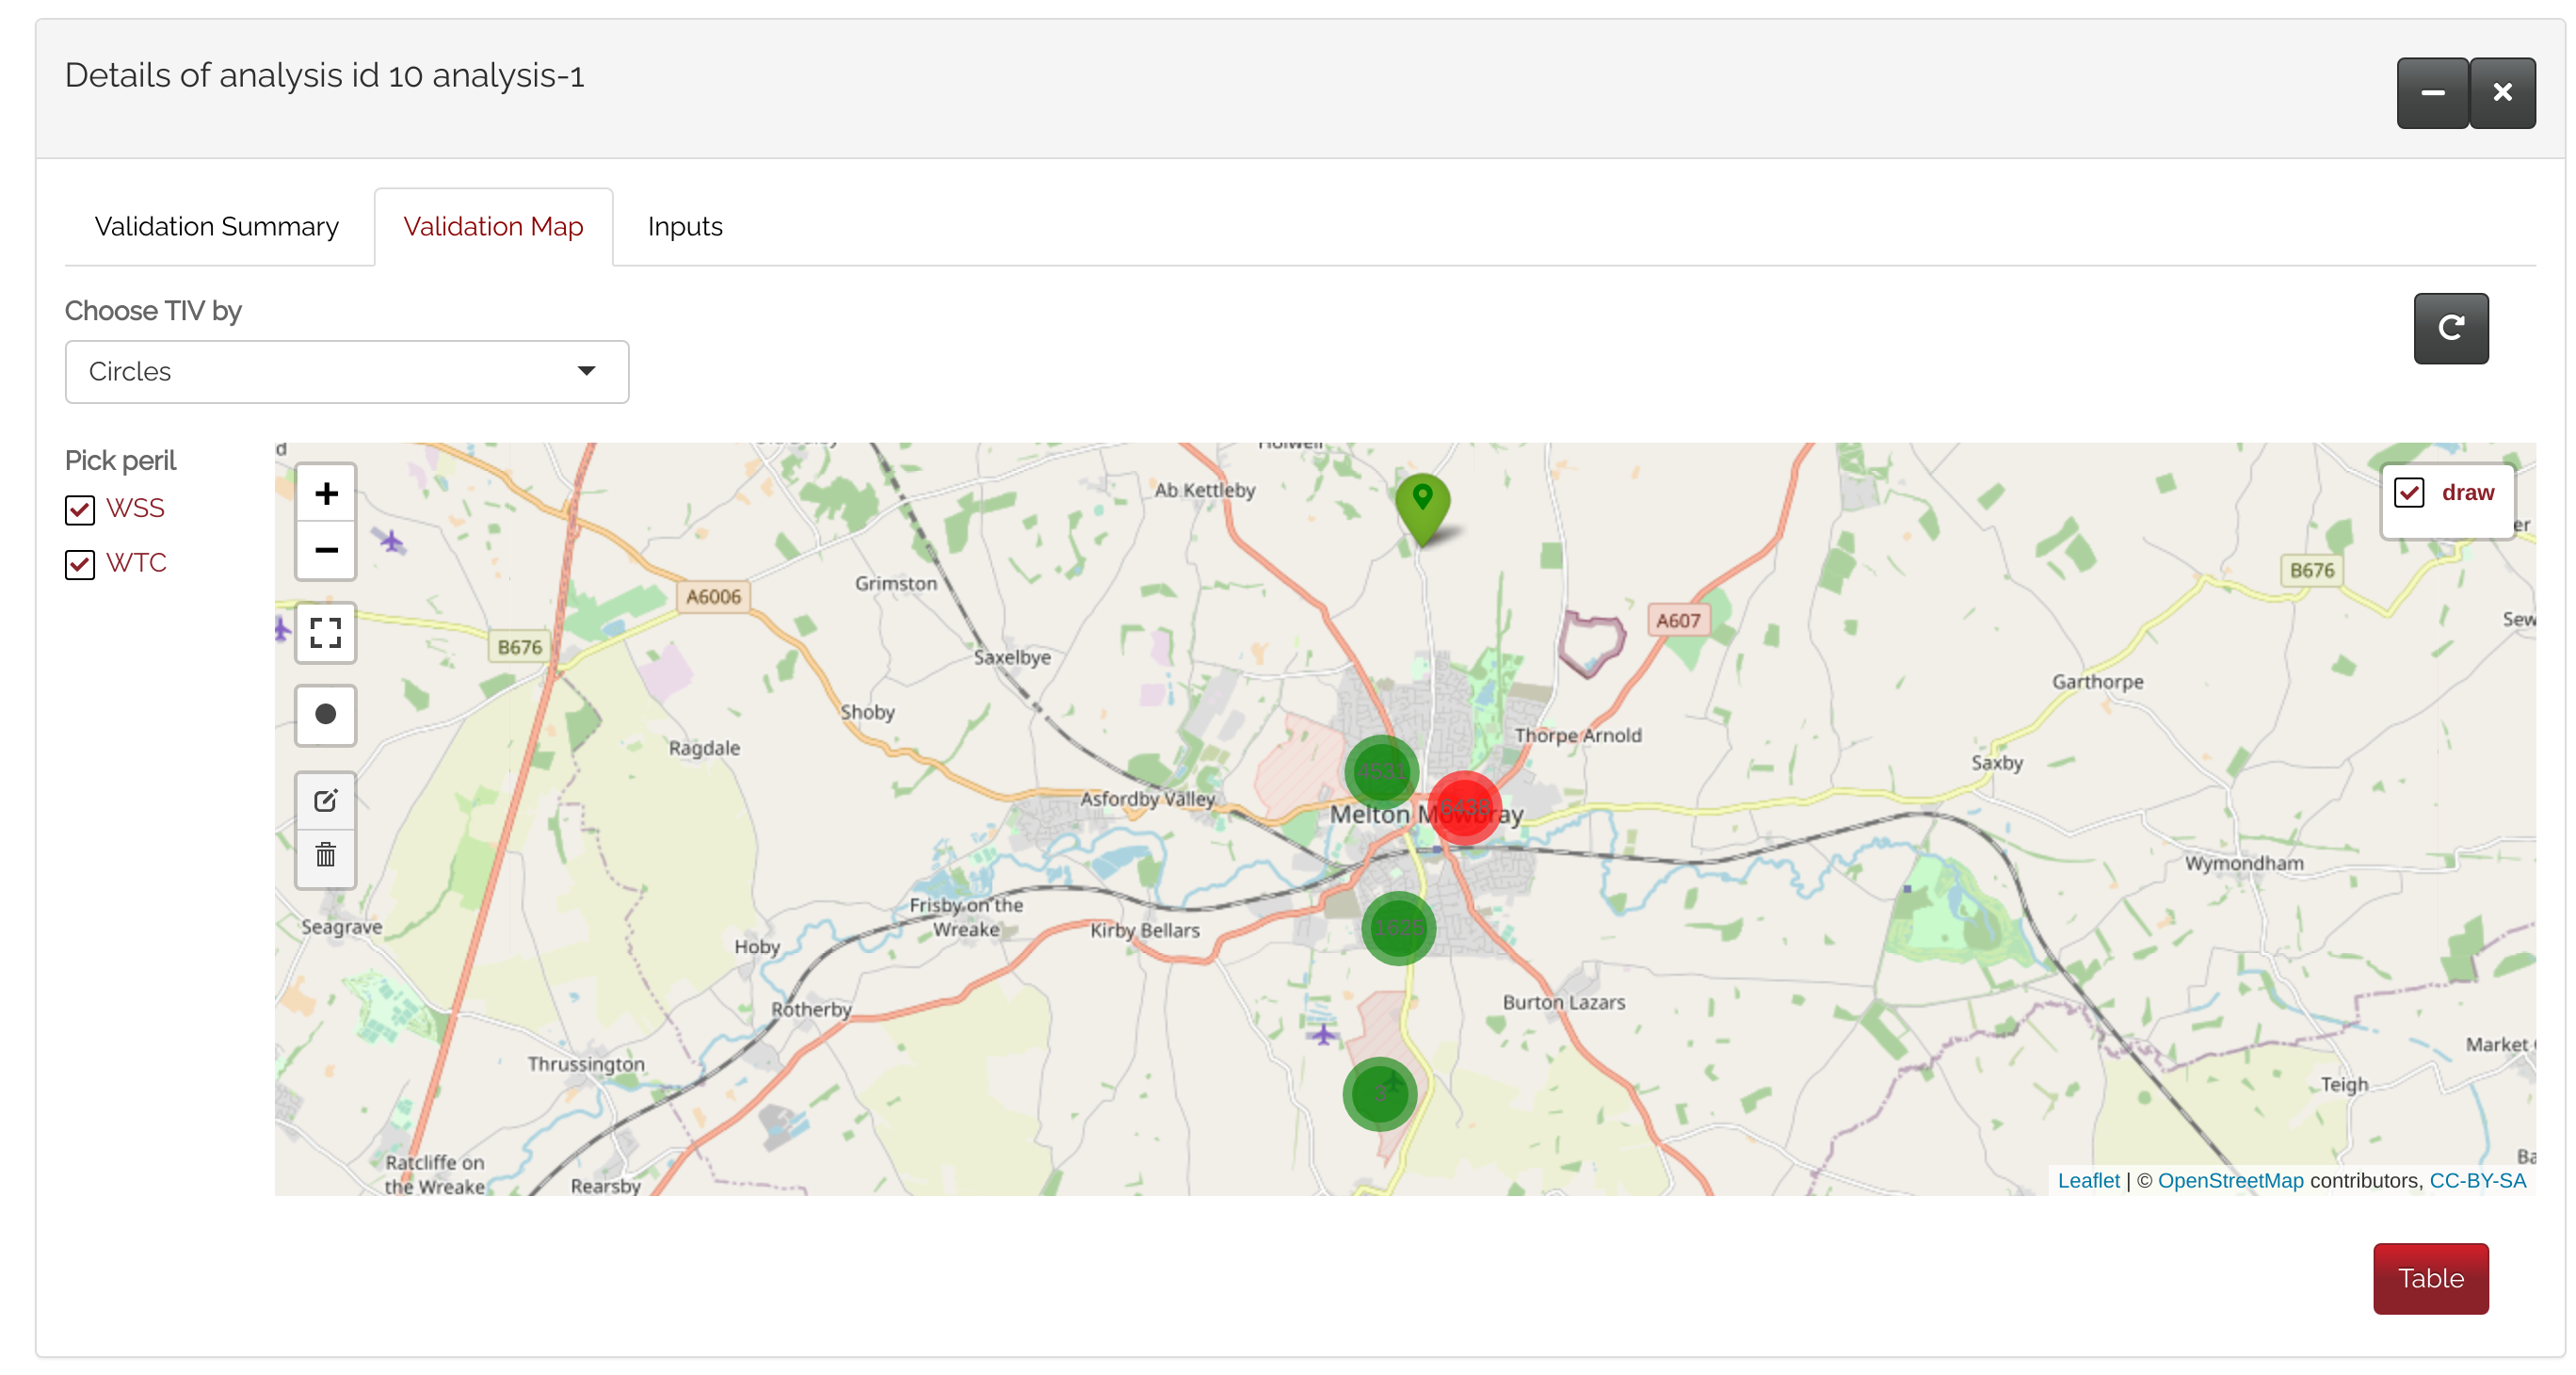 This new functionality allows users to interact with maps and extrapolate values of their choice via circles drawing, countries or regions.
Circles drawing allows users to draw and subsequently erase/modify multiple and overlapping circles on a map. By clicking on a specific circle, the following data is shown below the map: radius of circle, total TIV (Total Insured Value) of locations within the circle, and the number of locations. For each location, location ID, TIV, and street address are shown. The “Damage ratio” can be modified to adjust TIV values.
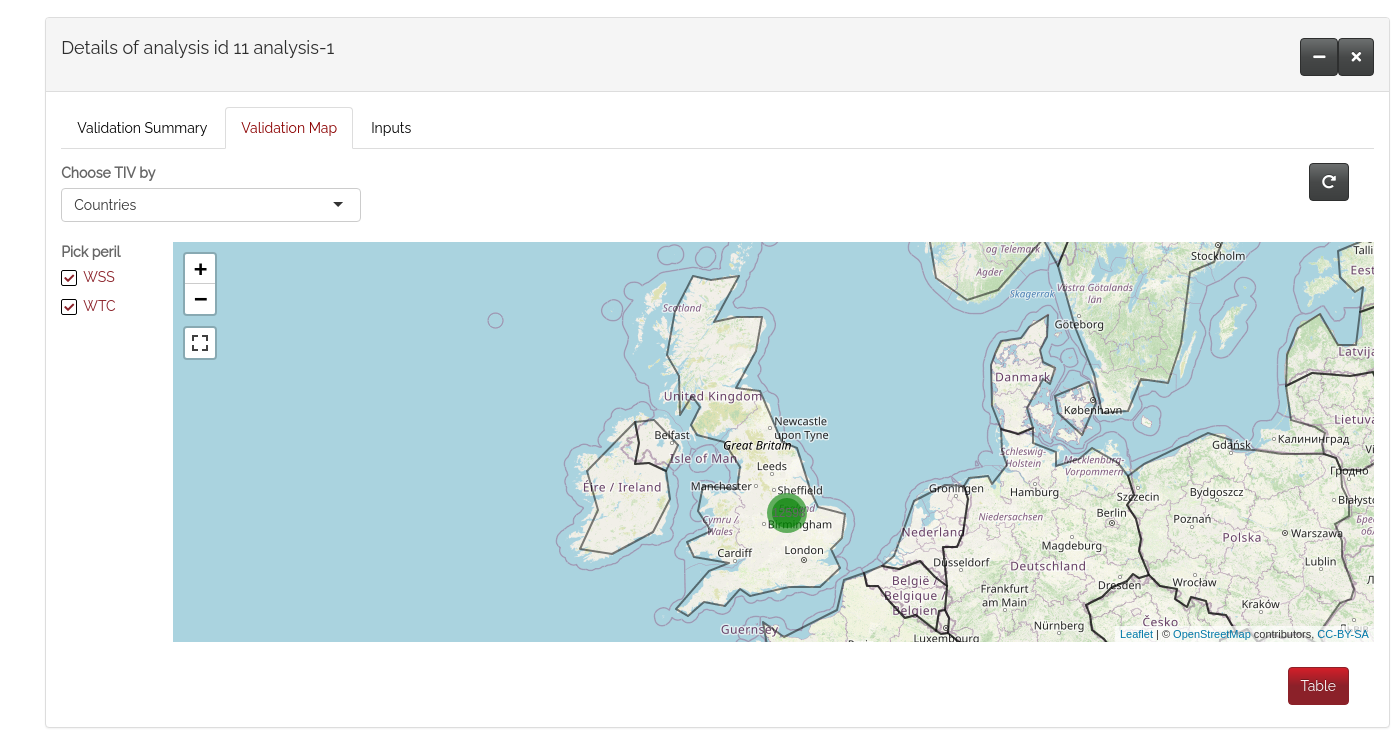
Countries selection allows users to click on a specific country to visualize information about locations within that area.
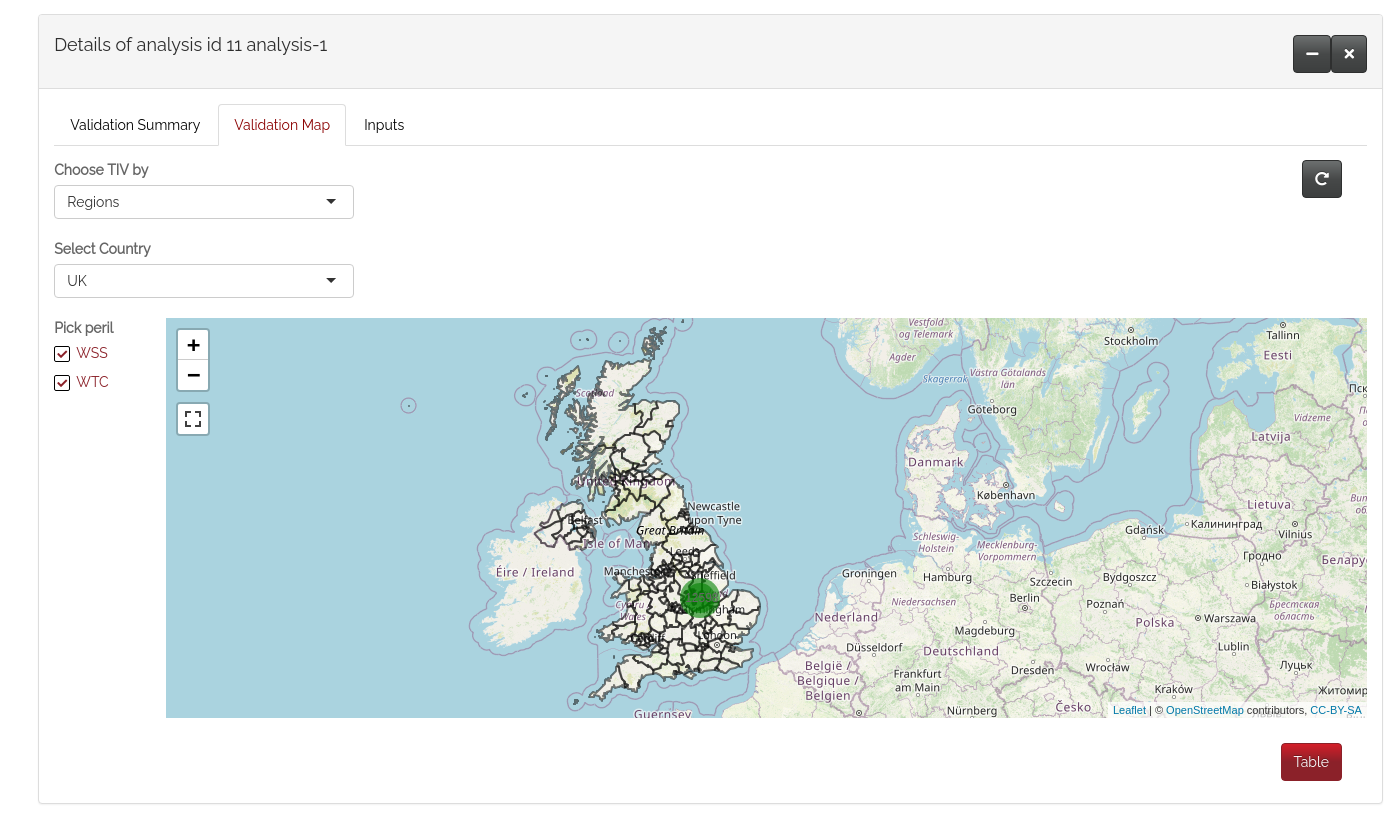
Regions selection allows users to visualize data within specific regions of Bangladesh, Philippines, and the UK. By clicking on one of the bordered areas, it is possible to extrapolate name of the region and total TIV.
Results display
The Dashboard section shows the results of an analysis run. It includes graphs made with the ggplot2 package and tables to display numerical outputs:
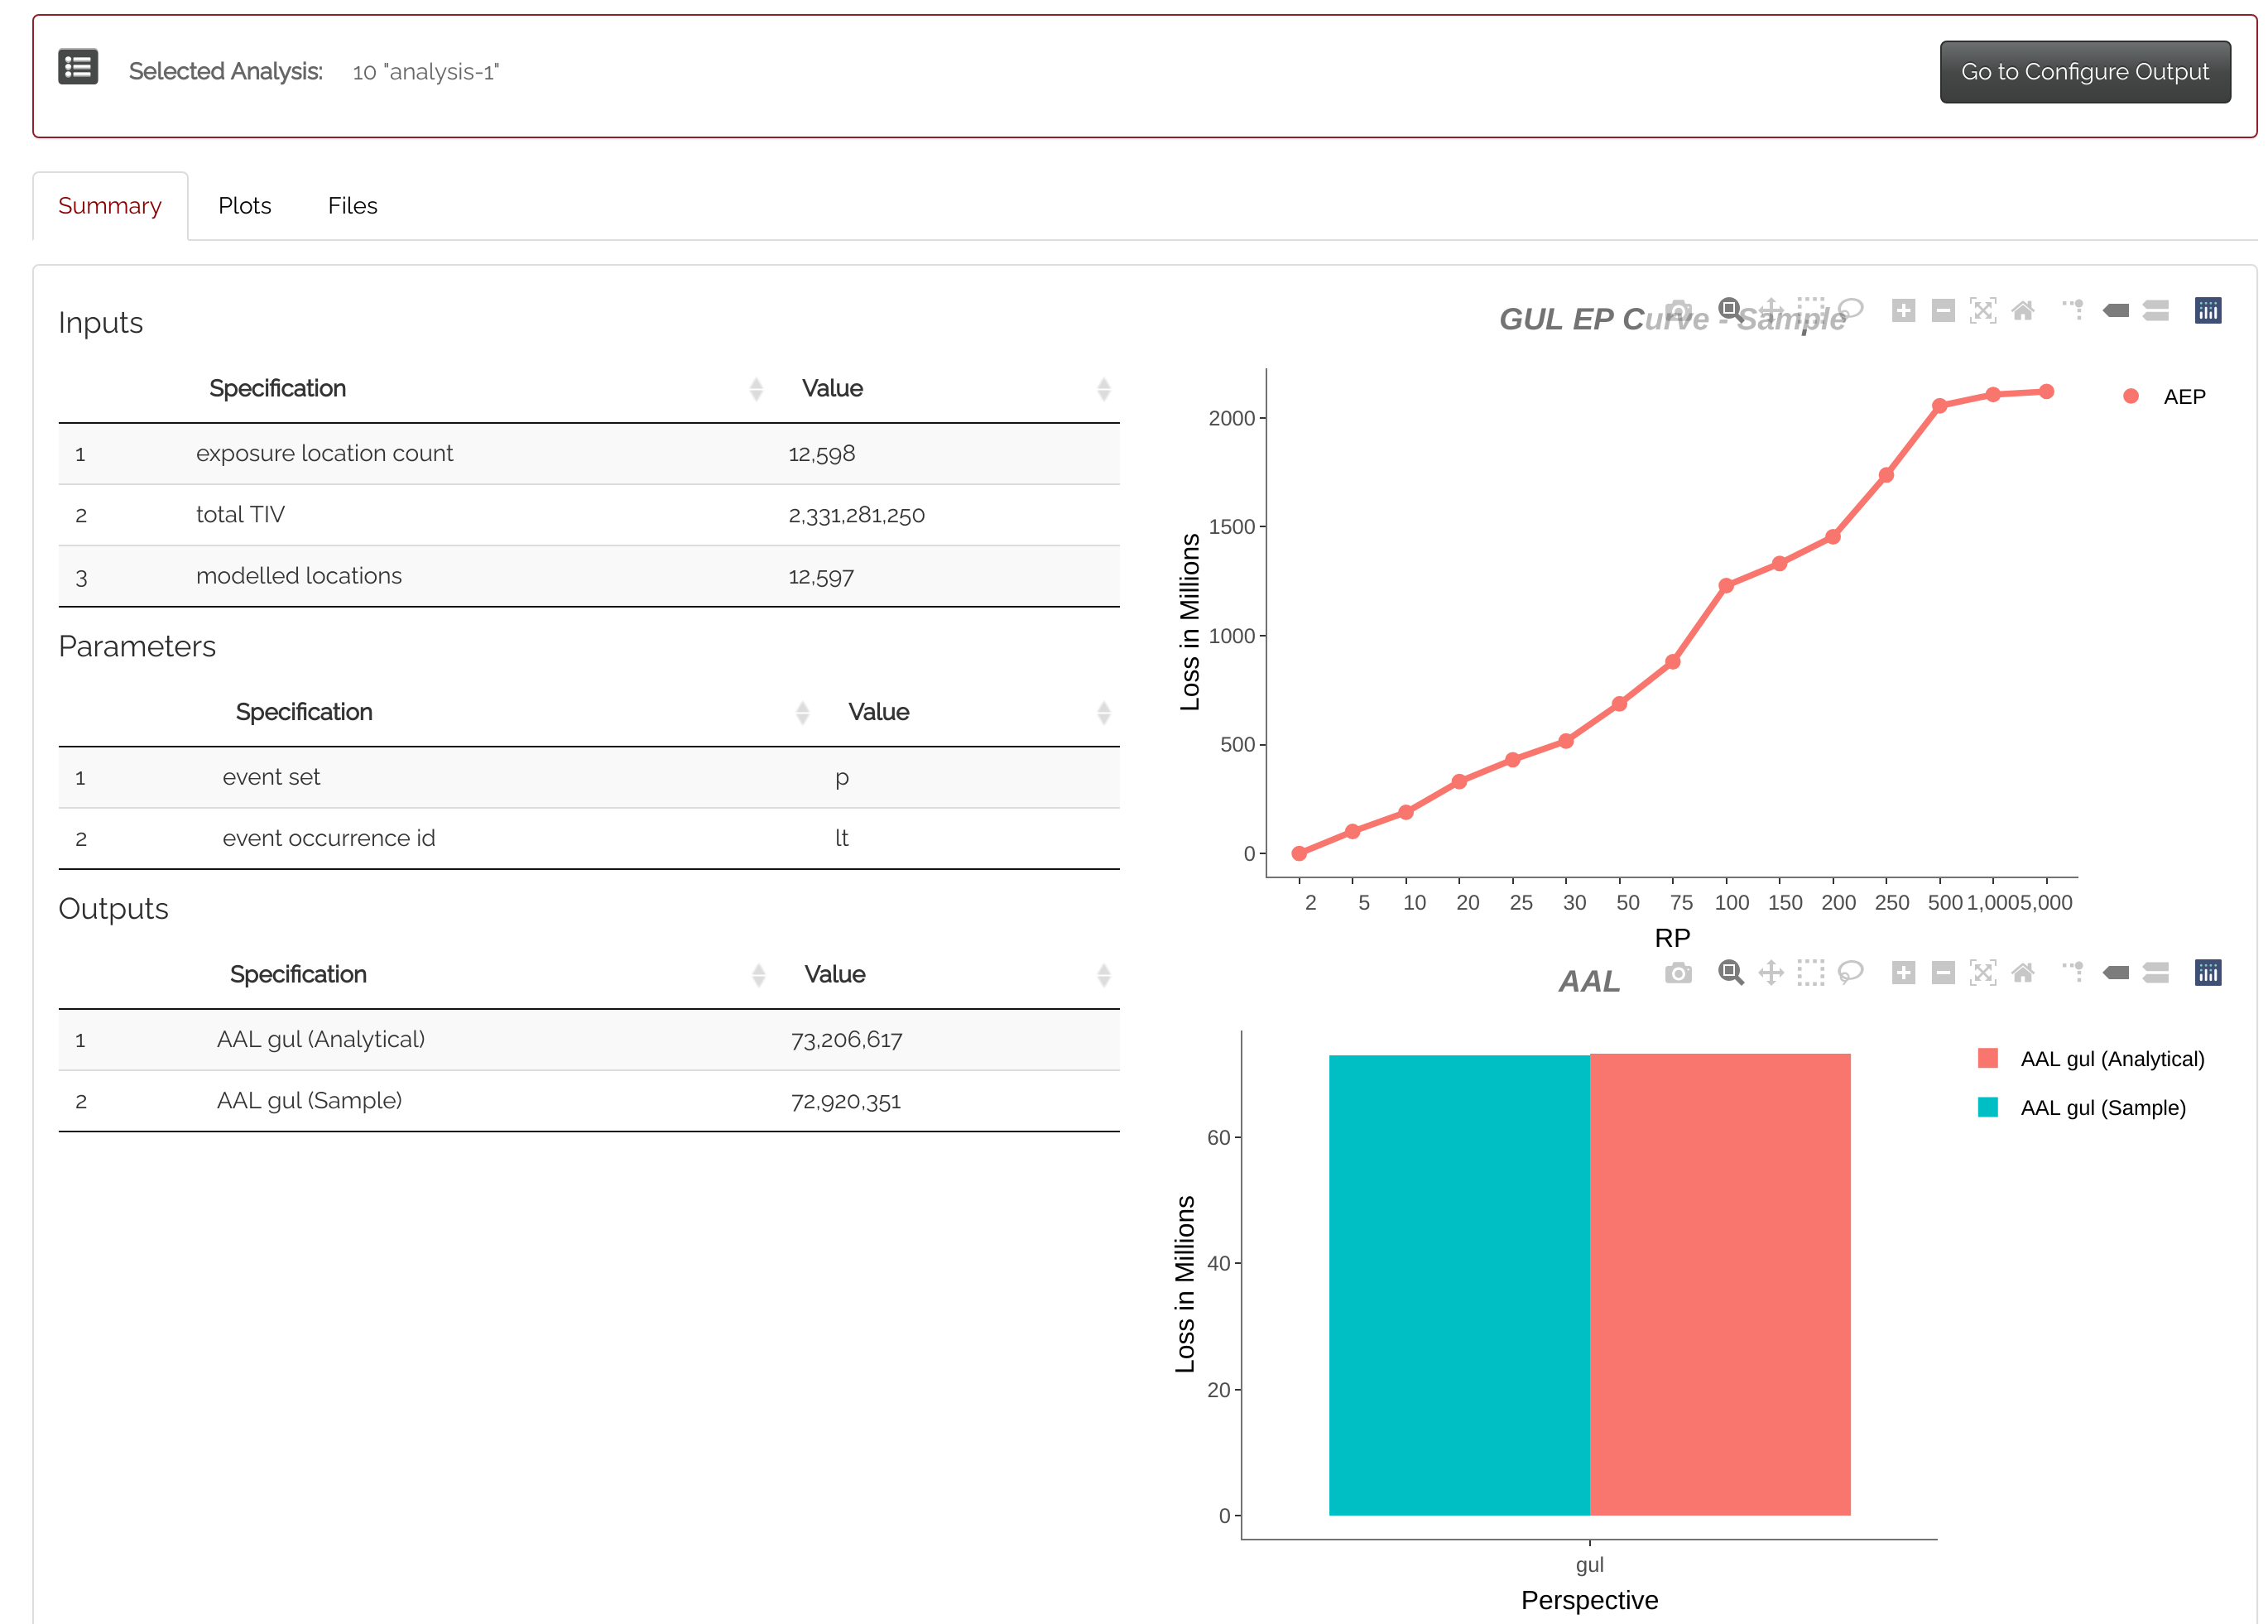
Additional plots can also be drawn in the “Plots” tab.
We have also made other minor changes, which we invite you to discover in the UI click here
We look forward to more exciting features coming up in the near future. Stay tuned!