

Mirai Solutions stays engaged in the development and maintenance of the front-end of the OASIS LMF (Loss Modeling Framework) platform.
The OASIS UI is under constant development, with new features coming out on a regular basis to enhance its usability. To get a general overview of the OASIS UI click here.
New features have been implemented in all three steps of the “Single Analysis” option. The following paragraphs go into details regarding each development.
Upload/Download of parquet files
The portfolio step requires data files to be uploaded. A new feature has been implemented which allows users to upload both csv and parquet files as the latter allow for faster data processing. Additionally, download location files in either extension is possible

Model customization
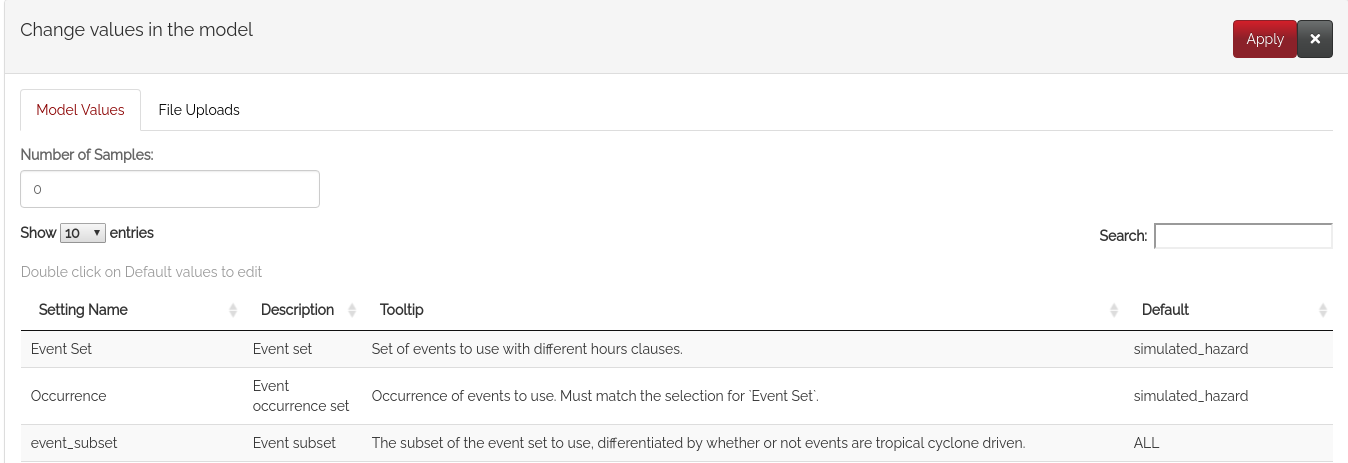
In the “Choose Analysis” step, models are not merely static anymore but can now include the option to be customized "model_configurable": [true] in their settings JSON file. The “Customize Model” button opens the customization functionalities, opening a panel below with two tabs.
In the “Model Values” tab, the user can double click on any cell under the “Default” column and proceed to edit.
In the “Files Upload” tab, the user can upload additional files or choose his from a previously created list to be attached to the analysis settings. The categories are: damage ratio paths, damage ratio lookup paths, disaggregation locator descriptions paths, schema file paths, vulnerability locator shapefile paths.
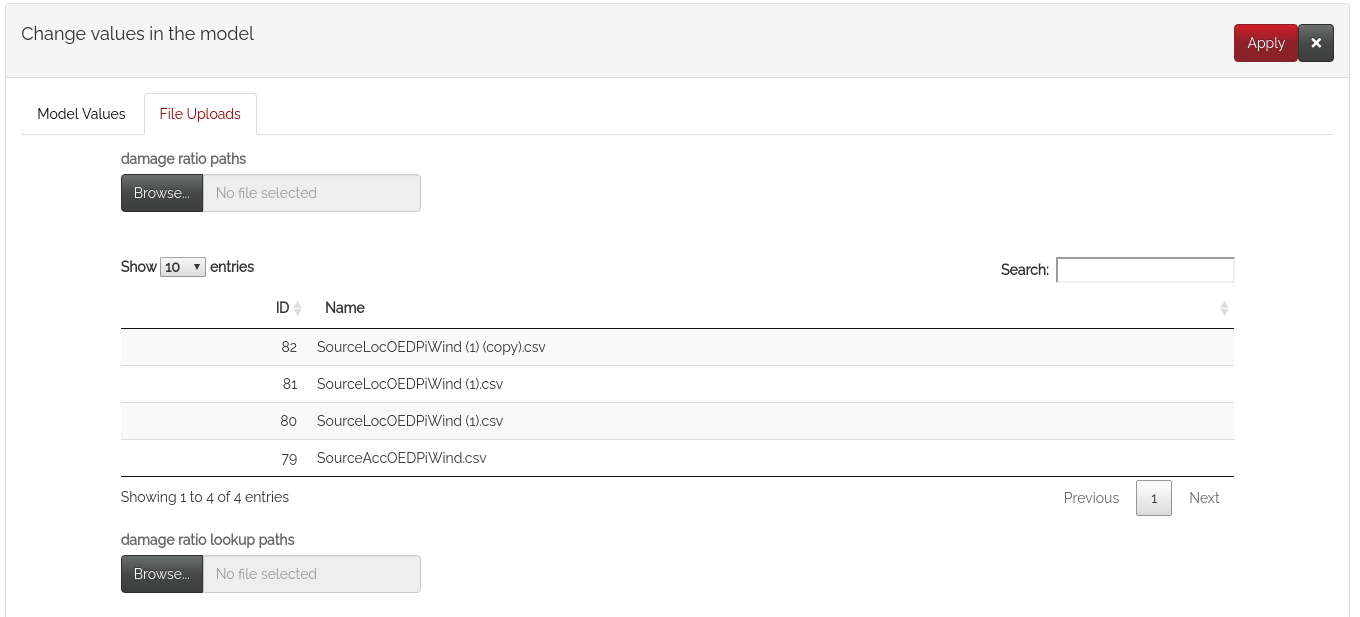
Once the user is done making edits, it is mandatory to click on the “Apply” button at the top right to save all changes in the new analysis settings. Some features of the analysis settings are present in the “Output Configuration & Run” step in the “Model Parameters” panel. If any mutual settings have been changed in the previous, the new version will appear here.
Interactive map
Maps are not only used for static visualizations, but also for the user to directly interact with and extract specific locations information. The addCircles() function from leafletProxy allows just for that:
leafletProxy("Map") %>% addCircles(
  lng = longitutde_on_click,
  lat = lattitude_on_click,
  radius = radius,
  layerId = "hilightArea",
  highlightOptions = highlightOptions(
    color = "green", weight = 5, bringToFront = FALSE, opacity = 1
  )
)
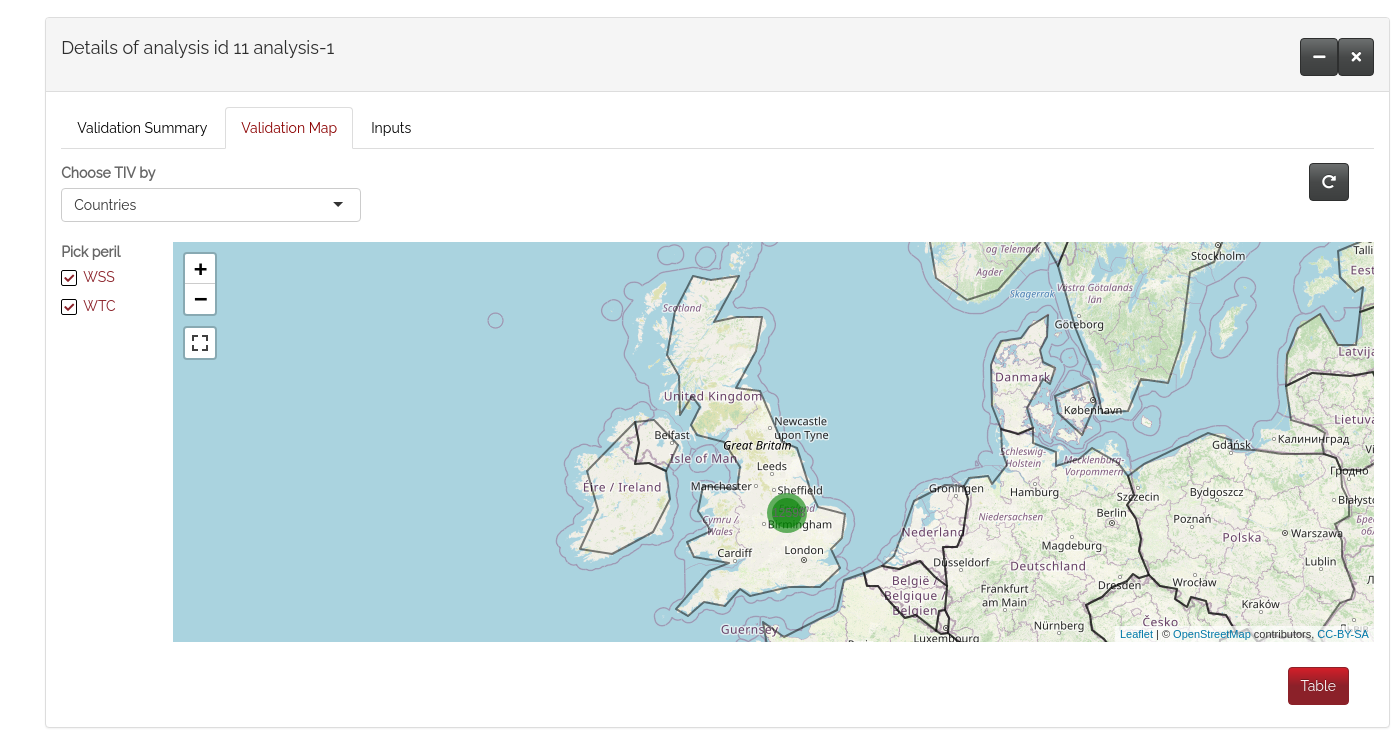
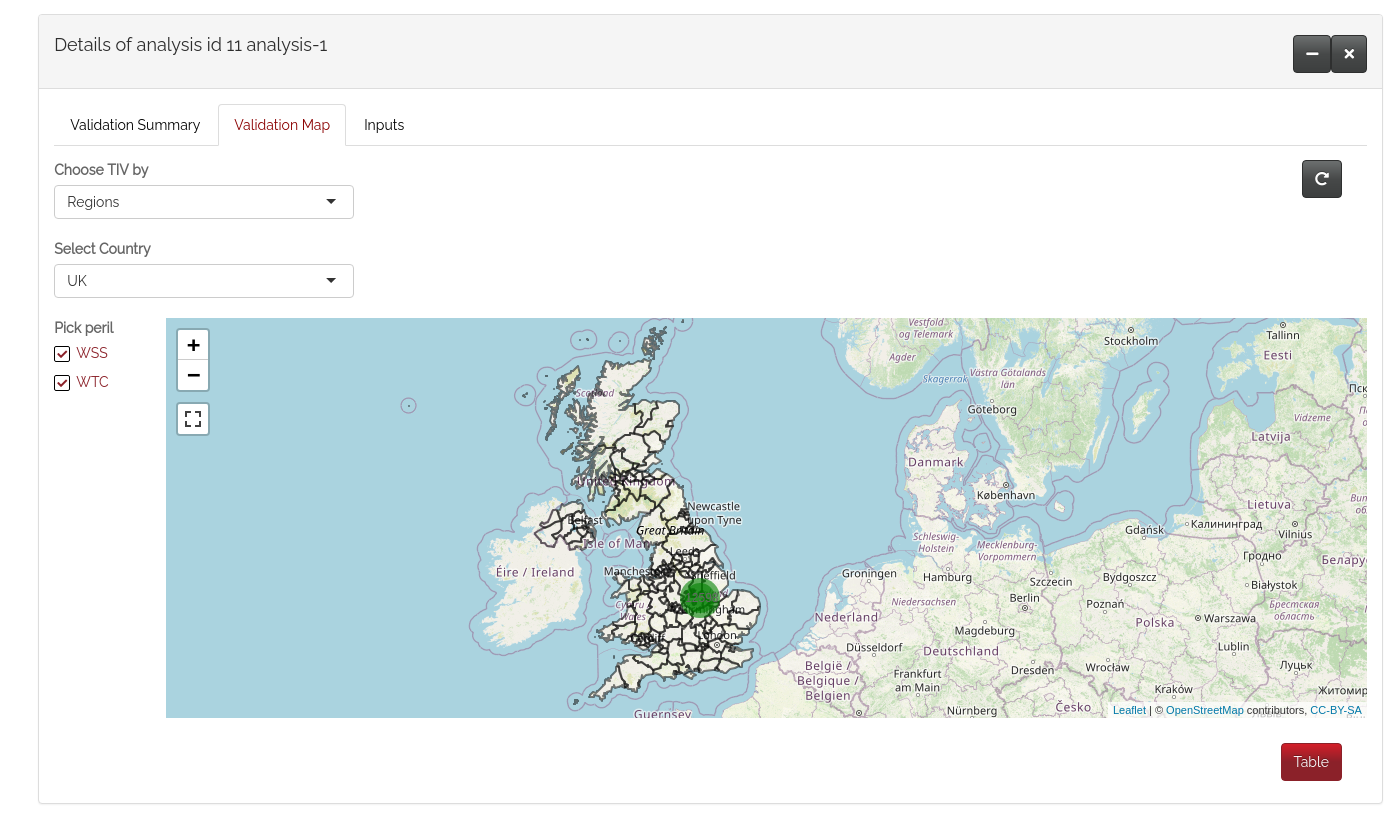
The “Validation Map” section allows users to directly interact with the map:
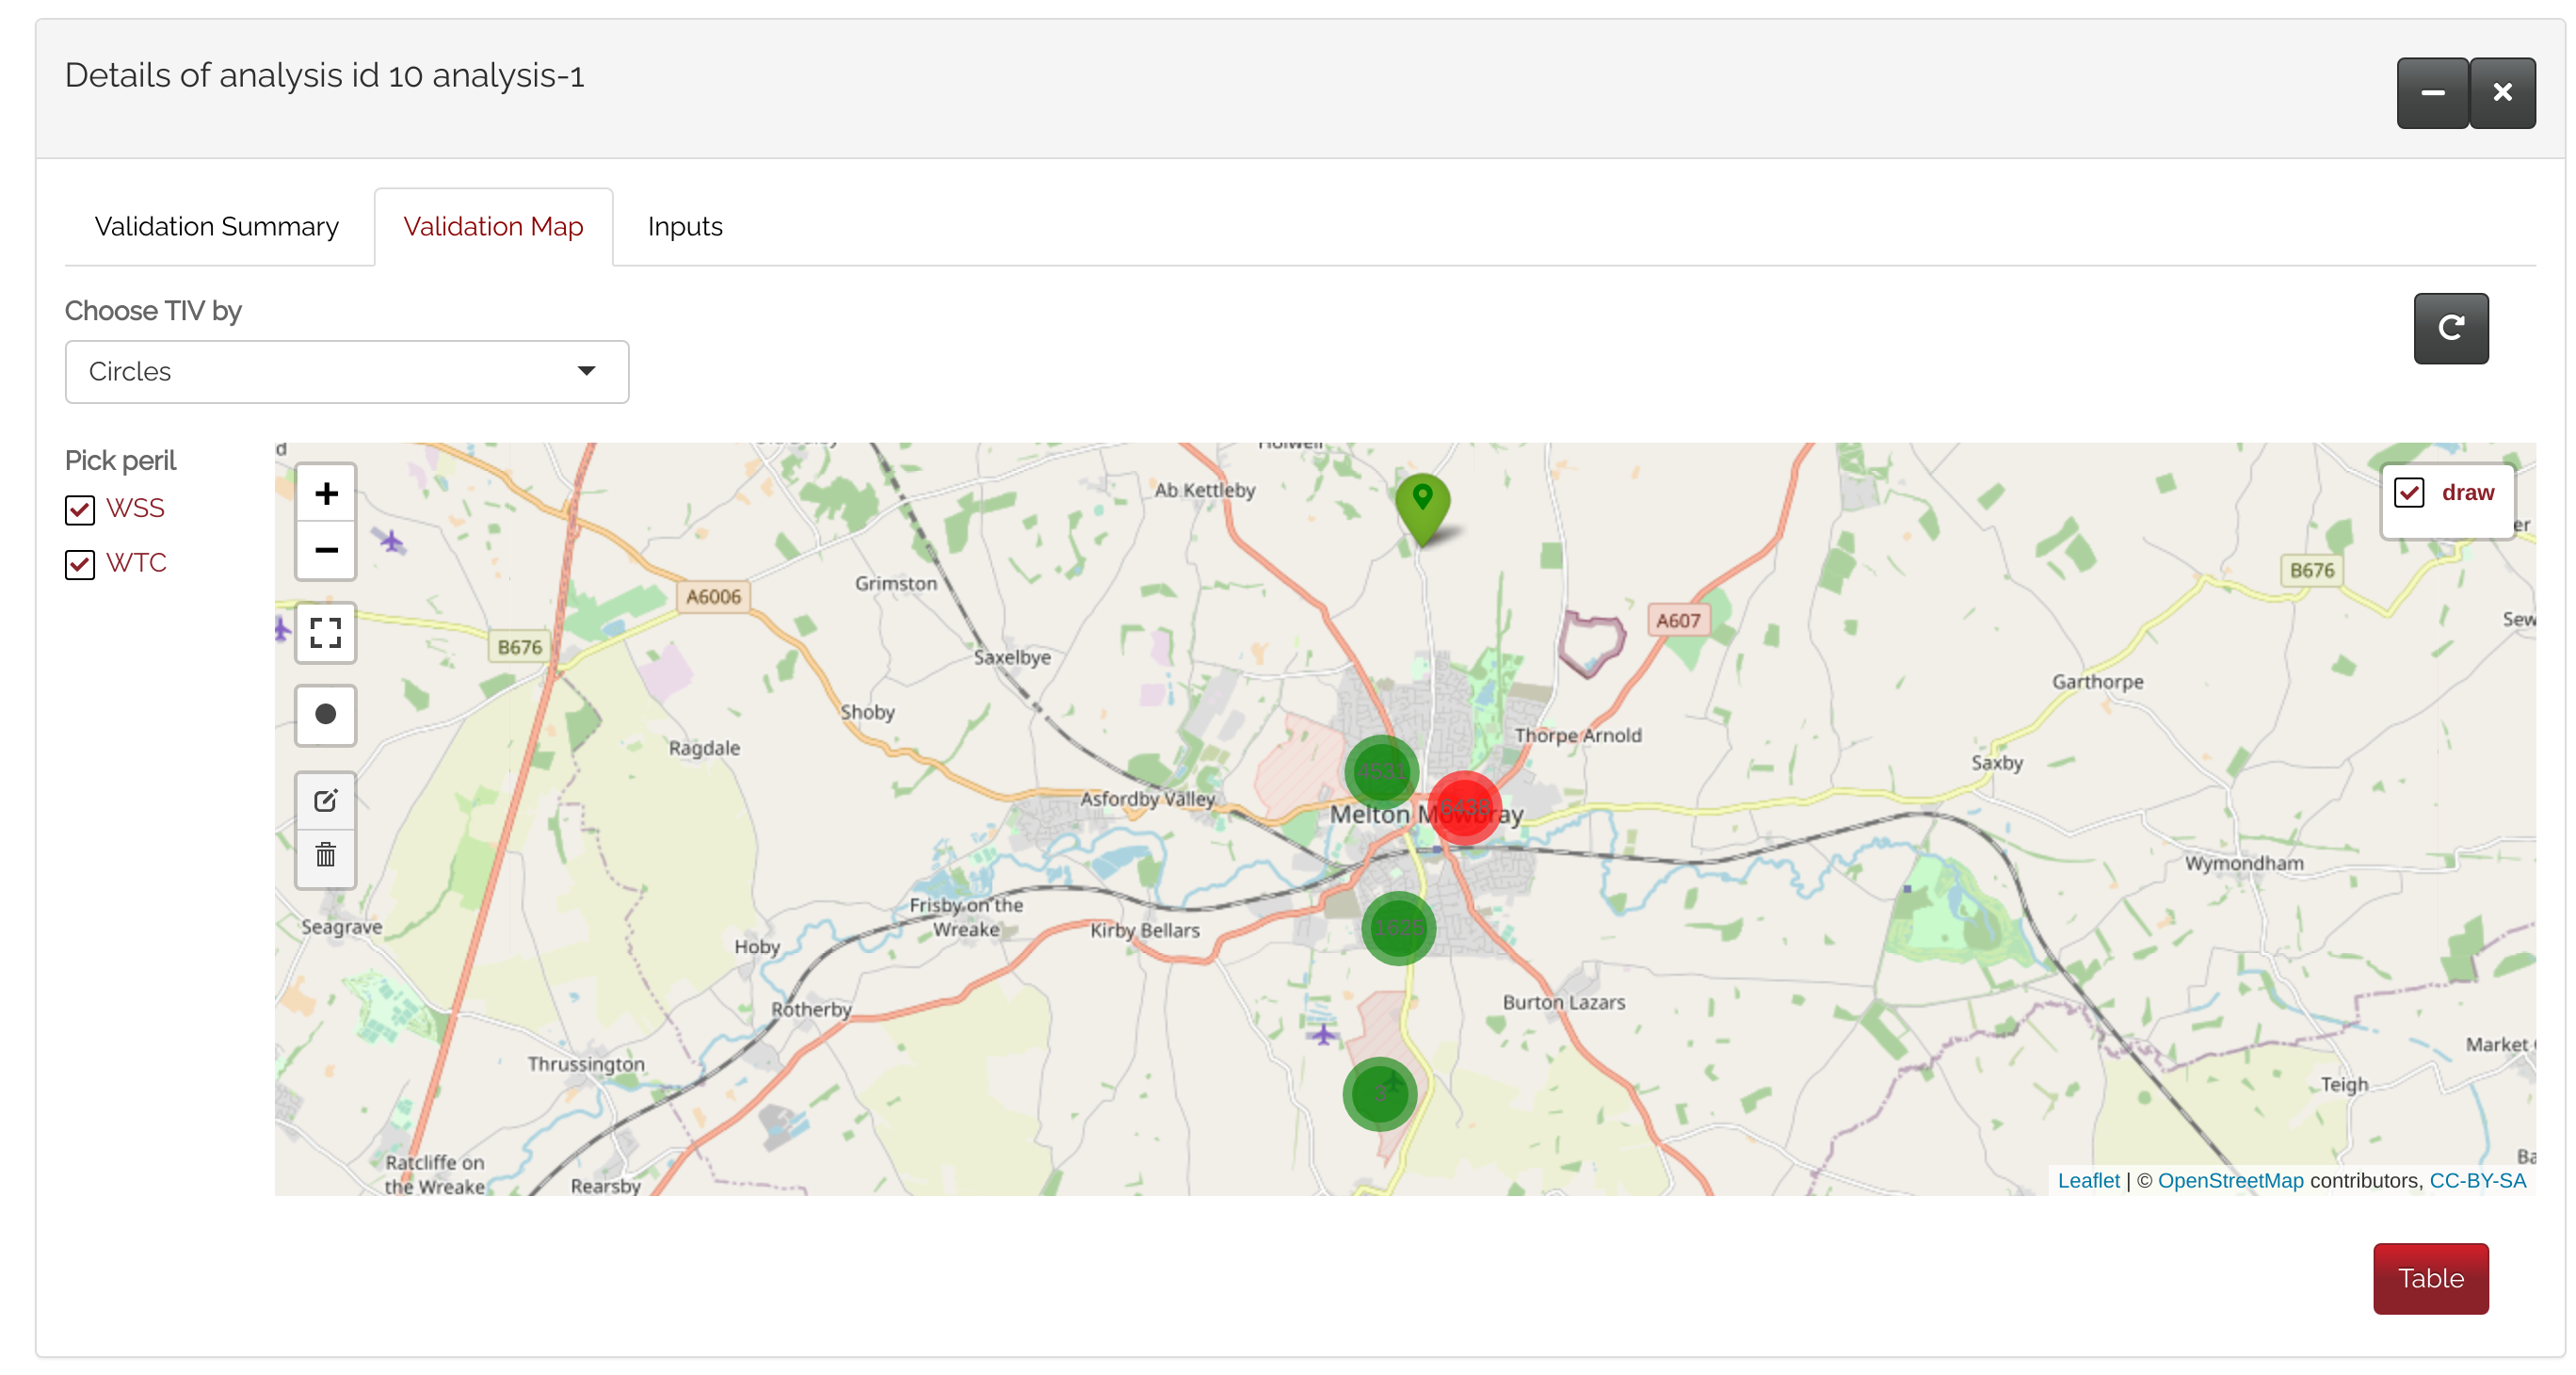 This new functionality allows users to select locations directly on the maps and extrapolate values of their choice via circles drawing, countries or regions.
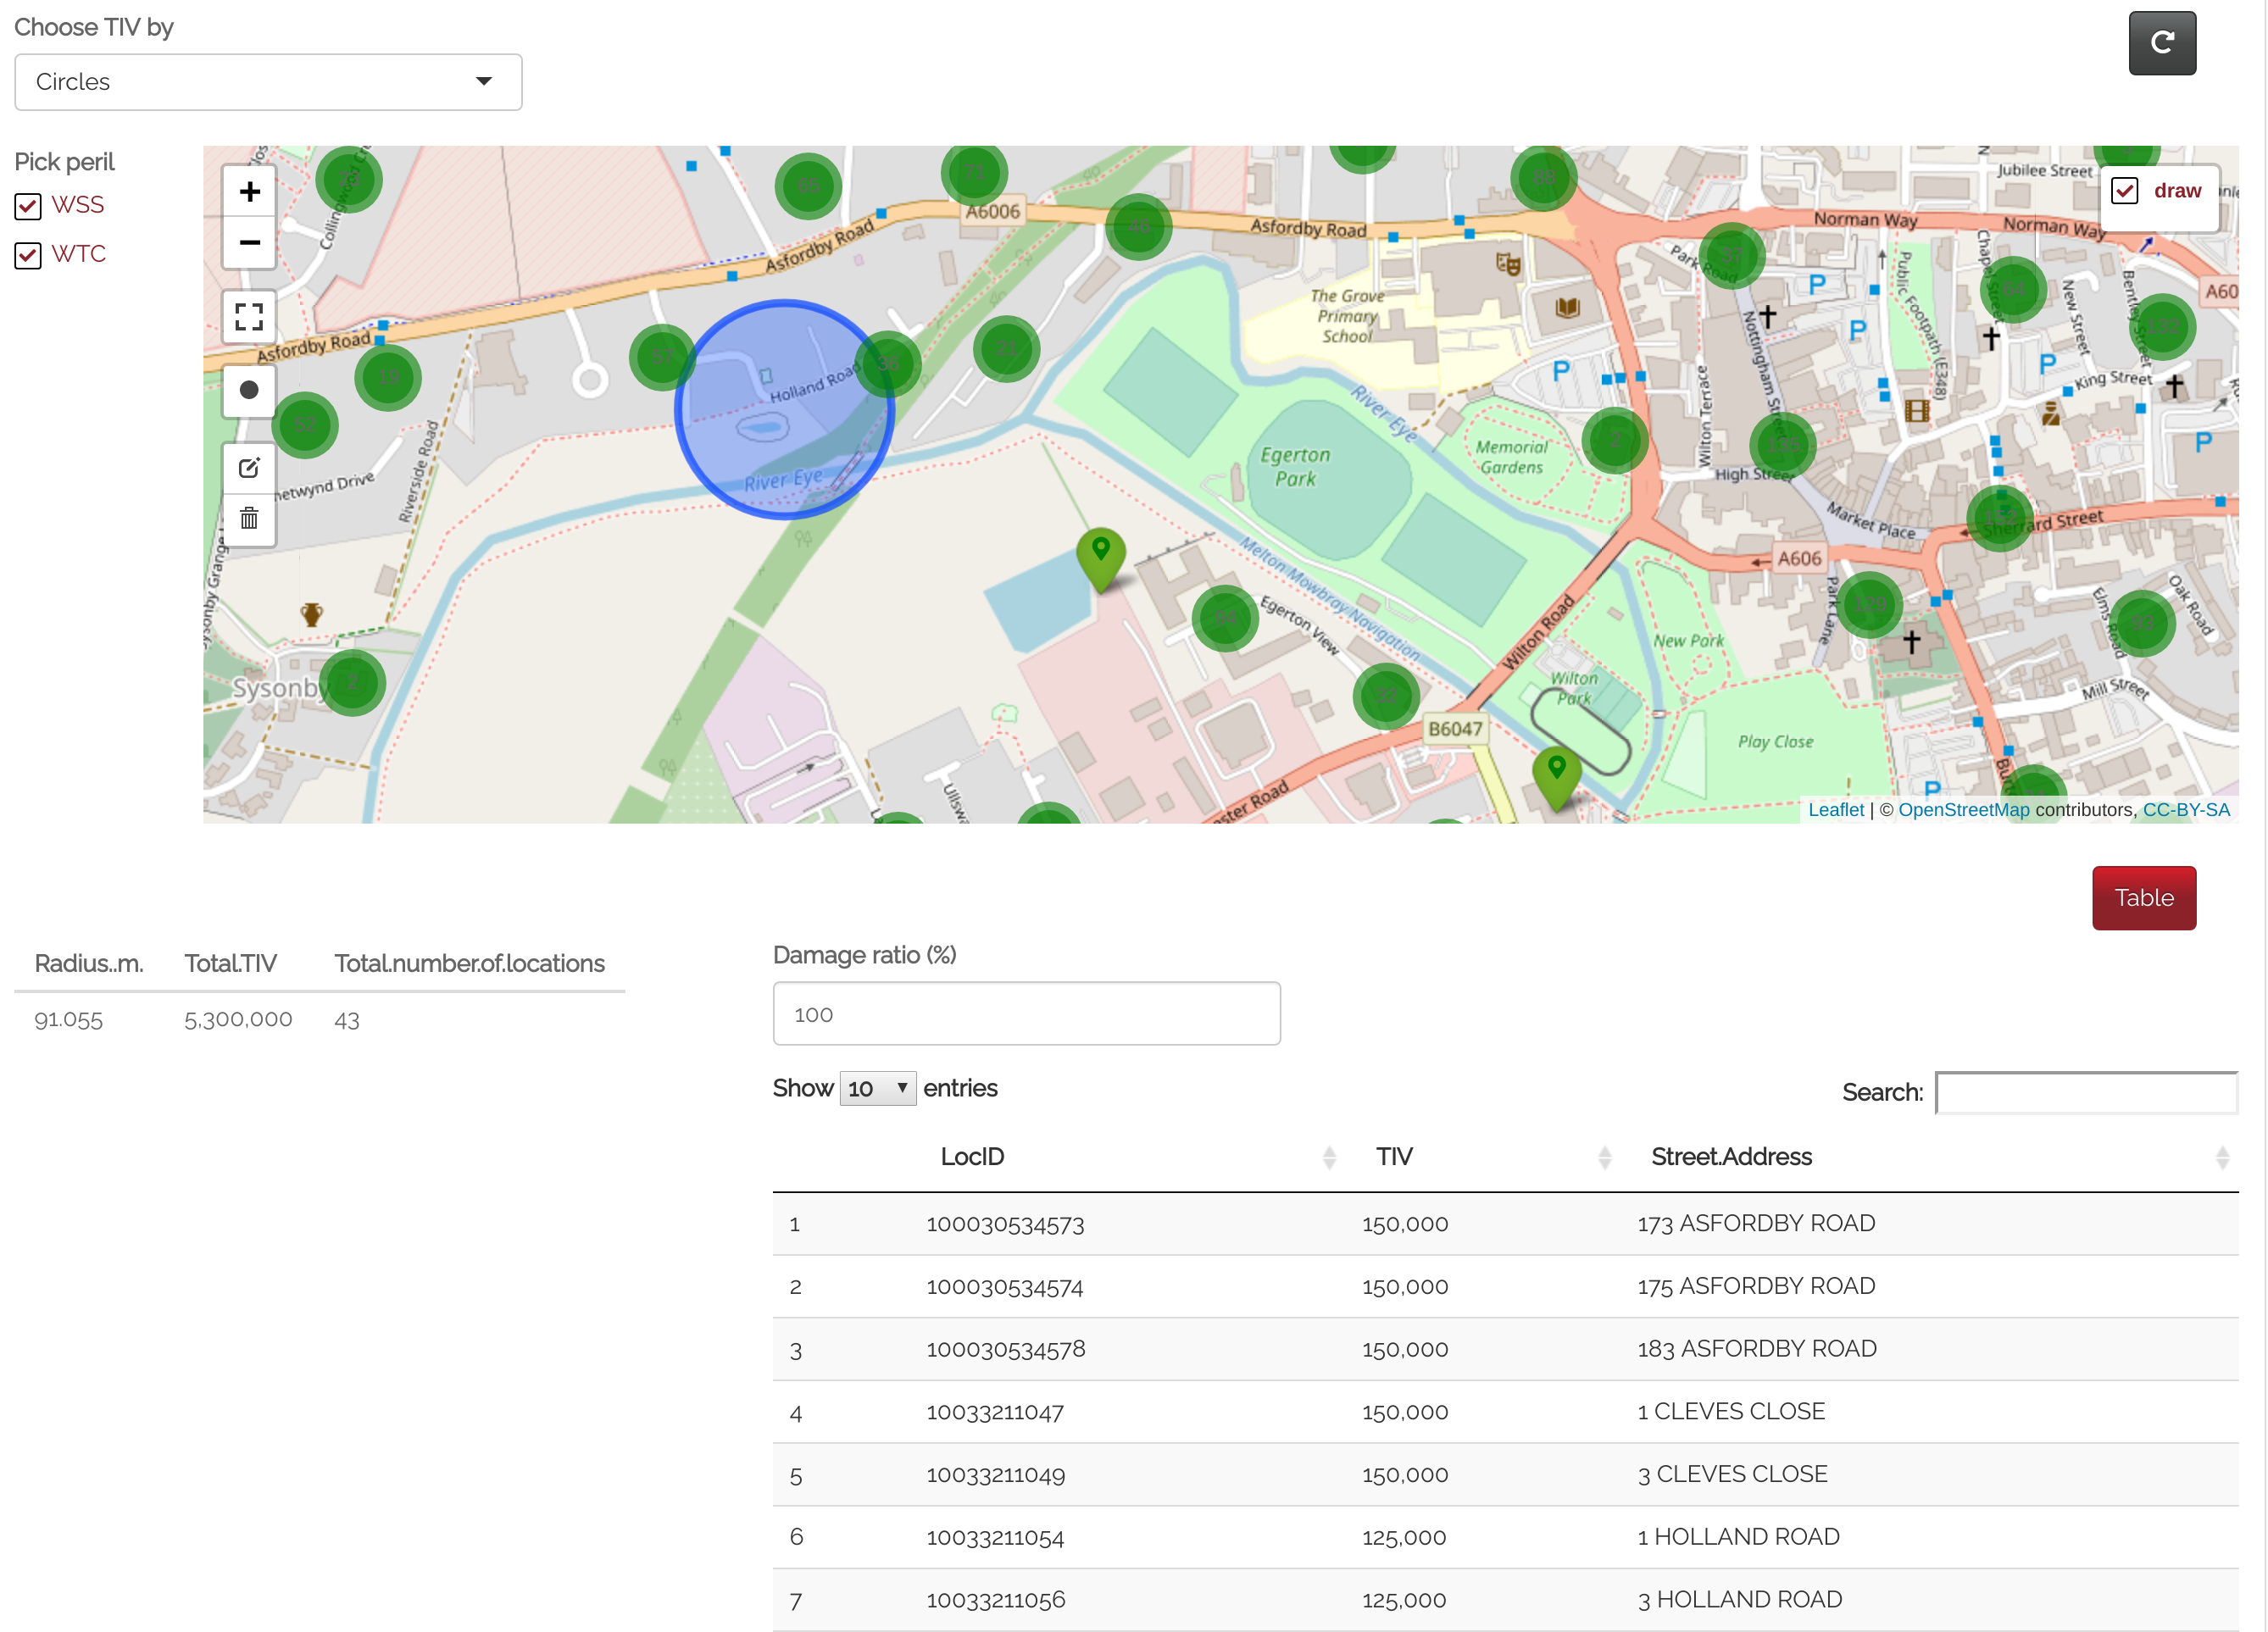
Circles drawing allows users to draw and subsequently erase/modify multiple and overlapping circles on a map. By drawing a circle with customizable radius and clicking on it, the following data is shown below the map: radius of circle, total TIV (Total Insured Value) of locations within the circle, and the number of locations. For each location, location ID, TIV, and street address are shown. The “Damage ratio” can be modified to adjust TIV values.
Countries selection allows users to click on a specific country to visualize information about locations within that area.
Regions selection allows users to visualize data within specific regions of Bangladesh, Philippines, and the UK. By clicking on one of the bordered areas, it is possible to extrapolate name of the region and total TIV.
New ORD list
The “Output Configuration & Run” step the place where an analysis can be run. The list of Summary levels has remained the same but new ORD (Open Result Data) levels have been added in the Reports. The goal of ORD is to produce standard outputs that can be compared across NatCat models. In addition to the original list, the new selection now includes: ELT Sample, ELT Quantile, ELT Moment, PLT Sample, PLT Quantile, PLT Moment, ALT Period, EPT Full Uncertainty AEP, EPT Full Uncertainty OEP, EPT Mean Sample AEP, EPT Mean Sample OEP, EPT per Sample Mean AEP, EPT per Sample Mean OEP, PSEPT AEP, PSEPT OEP.
Constant new developments are being made to the UI, so keep on checking our website!