

PEMG (Partial Equilibrium Model for Gas) is a Shiny app that calculates and visualizes optimal natural gas prices and consumption levels for a selection of European countries.
Technologies Used: Shiny and R for development, Leaflet for interactive maps, bslib (bootstrap) for modern UI design, CVXR to solve the optimization problem, and Azure Web Services plus Azure DevOps for easy continuous and scalable deployment.
The app models the 2013 European gas market as a base case. Users can adjust either a country’s gas production or exports to see how the market rebalances prices (first map) and consumption (second map).
Methodology: PEMG formulates and solves a convex (quadratic) optimization problem based on the methodology from T. Baltensperger (2016) to model oligopolistic equilibrium in the gas market. For further research on the topic see also Egging et al. (2020).
The model configuration specifies data sources and countries, guiding the optimization process to determine optimal price and consumption values across all selected countries based on specific parameters and constraints, including:
- 2013 gas price and consumption as the base case
- Current and maximum potential gas production
- Gas pipeline connections between countries and their capacity limits
- Existing contracts in 2013 between countries, including their distances
- Liquefied natural gas (LNG) producers
- Regasification capabilities
As a simplified model designed to process a complex optimization problem, a selection of European countries is chosen in order to balance accuracy and performance.
A fully comprehensive model would require considering all market players rather than a selected subset.
Some countries have been excluded because they were small producers or exporters, or had low gas consumption. Data for Ukraine could not be consolidated, although Ukraine was playing an important role in the 2013 gas transport.
Finally, the countries included in our demo, along with their respective roles, are:
| Country | type | Gas | Regas. (mcm/d) |
Liquef. (mcm/d) |
Prod. (mcm/d) |
|
|---|---|---|---|---|---|---|
| QAT | Qatar | Export | LNG | 286.9 | 145.4 | |
| ES | Spain | Regas. | NGL | 175.7 | ||
| FR | France | Regas. | NGL | 71.5 | ||
| NOR | Norway | Export | NGL | 336.8 | ||
| NL | Netherlands | Prod./Regas. | NGL | 37.4 | 541.4 | |
| BE | Belgium | Regas. | NGL | 42.3 | ||
| UK | United Kingdom | Prod./Regas. | NGL | 158.4 | 138.8 | |
| RUS | Russia | Export | NGL | 408.4 | ||
| IT | Italy | Prod./Regas. | NGL | 53.5 | 21.7 | |
| AT | Austria | Production | NGL | 4.7 | ||
| SK | Slovakia | Production | NGL | 0.3 | ||
| CH | Switzerland | Import | NGL | |||
| DE | Germany | Production | NGL | 28.8 | ||
| ALG | Algeria | Export | NGL | 111.4 | ||
| CZ | Czech Republic | Production | NGL | 0.5 | ||
| PL | Poland | Production | NGL | 9.7 |
A change in gas production — whether by a country or an exporter — creates a domino effect on price and consumption across all connected countries.
For example, a reduction in Russian or Norwegian gas exports would lead to a higher gas price in northern and central European countries, resulting in lower consumption, while Algeria would impact mainly Mediterranean countries.
The model dynamically adjusts to these changes, determining a new market equilibrium for all selected nations.
To understand which countries are affected by potential changes, we must examine existing contracts and pipeline capacities.
It is important to note that an increase in a country’s gas production will only impact others if the pipeline network can accommodate the additional volume.
The tables below display the connections between the selected countries, including:
- The price per mcm (thousands of EUR per Million Cubic Meters of gas)
- The pipeline capacity in mcm/d (Million Cubic Meters per Day)
Pipes to Austria | ||
| From | k€/mcm | mcm/d |
|---|---|---|
| DE | 10 | 26.88 |
| IT | 10 | 17.52 |
| SK | 8.16 | 143.1 |
Pipes to Belgium | ||
| From | k€/mcm | mcm/d |
|---|---|---|
| DE | 10 | 31.33 |
| FR | 10 | 6.72 |
| NOR | 25.74 | 42.6 |
| NL | 10 | 59.33 |
Pipes to Switzerland | ||
| From | k€/mcm | mcm/d |
|---|---|---|
| DE | 10 | 33.67 |
| FR | 10 | 20.46 |
| IT | 10 | 1.51 |
Pipes to Czech Republic | ||
| From | k€/mcm | mcm/d |
|---|---|---|
| DE | 10 | 88.08 |
| SK | 6.16 | 71.78 |
Pipes to Germany | ||
| From | k€/mcm | mcm/d |
|---|---|---|
| AT | 10 | 24.44 |
| BE | 10 | 14.93 |
| CZ | 10 | 92.69 |
| NOR | 20.03 | 42.93 |
| RUS | 43.95 | 88.06 |
| NL | 10 | 44.69 |
| PL | 10 | 85.4 |
Pipes to Spain | ||
| From | k€/mcm | mcm/d |
|---|---|---|
| FR | 10 | 15.14 |
| ALG | 21.55 | 40.73 |
Pipes to France | ||
| From | k€/mcm | mcm/d |
|---|---|---|
| BE | 10 | 68.41 |
| DE | 10 | 52.09 |
| ES | 10 | 15.14 |
| NOR | 16.3 | 53.66 |
Pipes to Italy | ||
| From | k€/mcm | mcm/d |
|---|---|---|
| AT | 10 | 104.3 |
| CH | 10 | 58.07 |
| ALG | 26.52 | 100.08 |
Pipes to Netherlands | ||
| From | k€/mcm | mcm/d |
|---|---|---|
| BE | 10 | 17.41 |
| DE | 10 | 27.34 |
| NOR | 20.08 | 88.04 |
Pipes to Poland | ||
| From | k€/mcm | mcm/d |
|---|---|---|
| CZ | 10 | 2.57 |
| DE | 10 | 4.42 |
| RUS | 36.28 | 85.4 |
Pipes to Slovakia | ||
| From | k€/mcm | mcm/d |
|---|---|---|
| AT | 6.92 | 22.75 |
| CZ | 5.22 | 37.21 |
| RUS | 50.5 | 234.48 |
From these relationships, we can identify which countries will experience changes in price and consumption in response to an increase or decrease in gas production by a given producer.
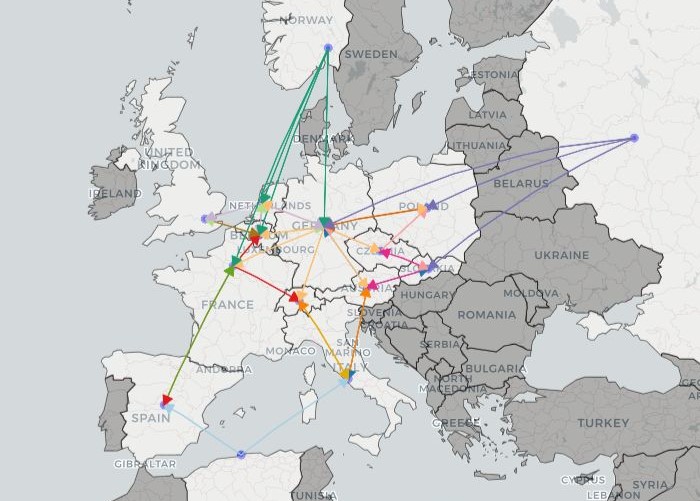
-
Map of gas pipelines
Gas is not transported solely through pipelines — some countries produce Liquefied Natural Gas (LNG), imported by others via ship, regasified, and then distributed to other nations. Our model includes one LNG exporter:
QAT - Qatar (286.9 mcm/d)
Additionally, we account for countries with regasification capacities:
Spain (175.7 mcm/d), France (71.5 mcm/d), Netherlands (37.4 mcm/d), Belgium (42.3 mcm/d), United Kingdom (158.4 mcm/d), Italy (53.5 mcm/d).
An update in the 2013 production of Qatar (286.9 mcm/d) will primarily impact countries with regasification capacity, as they rely on imported Liquefied Natural Gas (LNG) for distribution.
The model results for Price and Consumption are presented in heatmaps, with layers representing 3 key variables:
- The Ratio between the Optimal case and the Base case (percentage difference)
- The 2013 initial case (Base case)
- The Optimal case, as determined by the model
You can compare Price and Consumption across countries using the second and third heatmaps, while the Ratio heatmap shows how much a country’s optimal case deviates from the 2013 Base case.
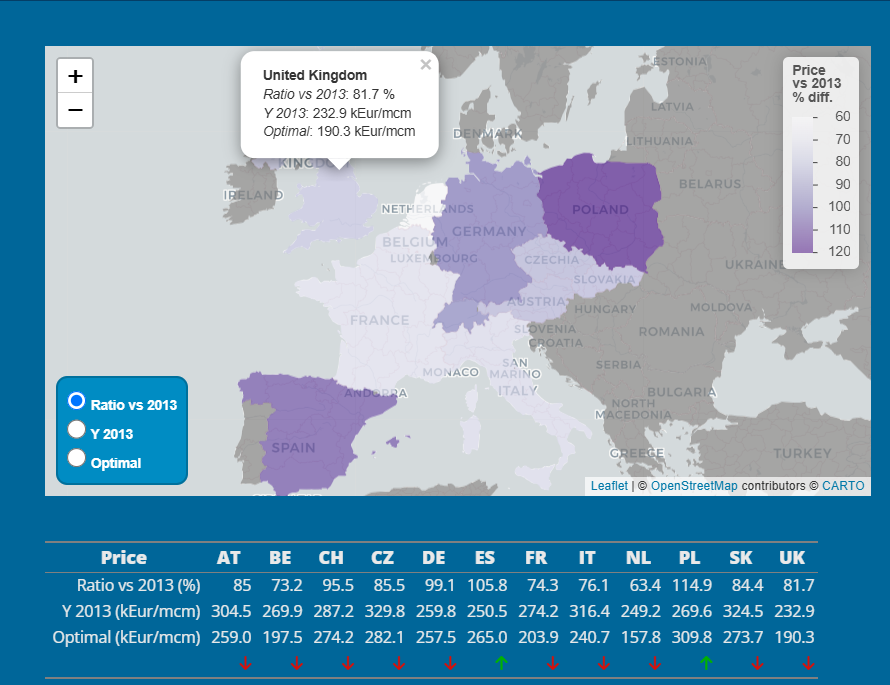
-
Model results: gas price
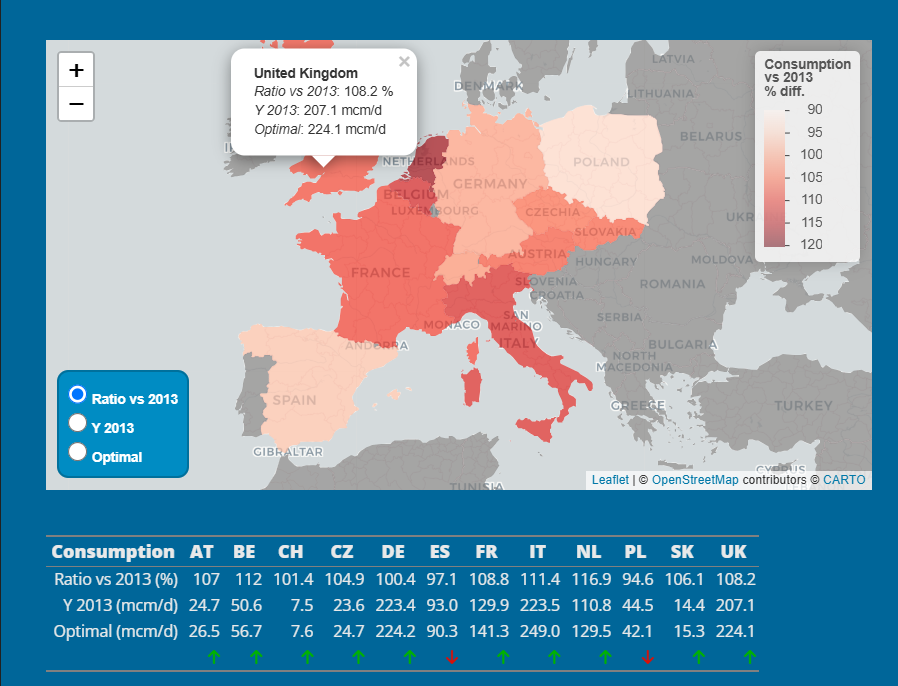
-
Model results: gas consumption
It’s your turn now to play with PEMG then: (1) adjust the gas production values for the countries, (2) run the model, and (3) explore the results!
If you’re interested in learning more or providing feedback, please get in touch. We’d be happy to answer your questions and take your suggestions into account for future improvements and enhancements.
Similarly, if you have more up-to-date data you’d like to integrate into the model, feel free to share it with us.