Our Covid19 app provides global view of the pandemic, but how effective is the vaccination in Switzerland?
Since May 2020 we are showing on our gallery a dashboard with a global view of the COVID-19 Pandemic, including a split by continent and country. We use publicly available data from the COVID-19 Data Hub, a great open source project providing a unified data set from local official data from all over the world.
Being Mirai a Swiss-based Company, our gallery hosts also one page dedicated to Switzerland. The current vaccination status of almost any country is also available, however, our data are not detailed enough to grasp a more insightful report of vaccination effectiveness.
In this article we will have a closer look at what reported by the Swiss Federal Office for Public Health (BAG) on COVID-19 vaccination breakthroughs and compare them with cases occurring within the unvaccinated population. We will focus on the effects on different age classes reading directly the Swiss Federal Office for Public Health (BAG) data from opendata.swiss where such information is made publicly available through API. Hopefully we are also giving some indications to readers who would like to try the same using R.
Reading BAG data
We are interested in the weekly BAG reports about vaccination breakthroughs occurred in the last 4 weeks.
Thanks to the well maintained data documentation we can identify the data we want to get. The R package jsonlite is all we need to read from the API
bag_api_url = "https://www.covid19.admin.ch/api/data/context/"
bag_sources = jsonlite::fromJSON(bag_api_url)
str(bag_sources, max.level = 2, strict.width = "cut")
List of 3
 $ sourceDate : chr "2021-10-19T07:47:56.000+02:00"
 $ dataVersion: chr "20211019-4xtuiycn"
 $ sources    :List of 6
  ..$ comment   : chr "OpenData DCAT-AP-CH metadata is now available as well."..
  ..$ opendata  :List of 3
  ..$ schema    :List of 2
  ..$ readme    : chr "https://www.covid19.admin.ch/api/data/documentation/"
  ..$ zip       :List of 2
  ..$ individual:List of 2
With just 3 lines of code we can get all data sources from the website opendata.swiss and store them in the object bag_sources, an R list containing all links to the JSON sources mentioned in the documentation. As an example, the code below shows how to read weekly breakthrough cases of vaccinated people, aggregated at weekly level for different age classes.
source_weekly_by_age <- bag_sources$sources$individual$json$weekly$byAge
str(source_weekly_by_age, strict.width = "cut")
List of 7
 $ cases           : chr "https://www.covid19.admin.ch/api/data/20211019-4xtu"..
 $ casesVaccPersons: chr "https://www.covid19.admin.ch/api/data/20211019-4xtu"..
 $ hosp            : chr "https://www.covid19.admin.ch/api/data/20211019-4xtu"..
 $ hospVaccPersons : chr "https://www.covid19.admin.ch/api/data/20211019-4xtu"..
 $ death           : chr "https://www.covid19.admin.ch/api/data/20211019-4xtu"..
 $ deathVaccPersons: chr "https://www.covid19.admin.ch/api/data/20211019-4xtu"..
 $ test            : chr "https://www.covid19.admin.ch/api/data/20211019-4xtu"..
source_weekly_cases_by_age_vacc <- source_weekly_by_age$casesVaccPersons
weekly_cases_by_age_vacc <- fromJSON(source_weekly_cases_by_age_vacc)
str(weekly_cases_by_age_vacc, strict.width = "cut")
'data.frame':	1672 obs. of  13 variables:
 $ date                : int  202104 202104 202104 202104 202104 202104 202104..
 $ altersklasse_covid19: chr  "0 - 9" "0 - 9" "0 - 9" "0 - 9" ...
 $ vaccination_status  : chr  "fully_vaccinated" "partially_vaccinated" "not_"..
 $ entries             : int  0 0 7 303 0 1 1 907 0 0 ...
 $ sumTotal            : int  0 0 7 303 0 1 1 907 0 0 ...
 $ pop                 : int  5 17 877077 NA 51 1056 846968 NA 396 7793 ...
 $ inz_entries         : num  0 0 0.8 NA 0 94.7 0.12 NA 0 0 ...
 $ geoRegion           : chr  "CHFL" "CHFL" "CHFL" "CHFL" ...
 $ type                : chr  "COVID19Cases" "COVID19Cases" "COVID19Cases" "C"..
 $ type_variant        : chr  "vaccine" "vaccine" "vaccine" "vaccine" ...
 $ vaccine             : chr  "all" "all" "all" "all" ...
 $ data_completeness   : chr  "limited" "limited" "limited" "limited" ...
 $ version             : chr  "2021-10-19_07-47-56" "2021-10-19_07-47-56" "20"..
For our scope we must also read Hospitalizations and Deaths entries, available from other elements of the bag_sources list.
The data documentation makes us aware of the following restrictions and warnings about the collected data:
- Confirmed infections among vaccinated people can be underestimated due to lower tendency of this group to be tested.
- During the last month the populations of Vaccinated and Unvaccinated changed, i.e. the vaccinated population has increased.
- Many infected people have unknown vaccination status, however, a more complete information is available for hospitalized and deaths cases.
To solve the second issue, as suggested by BAG, when computing cases per 100’000 people we will use the average of the vaccinated an unvaccinated populations across the month. Moreover, given 3., we are unable to perform meaningful comparisons across the reported infections, hence we must focus on hospitalizations and deaths where the vaccination status is almost completely reported.
This is how the data from BAG look like, after aggregation by 5 age groups and a little manipulation on on our side:
# A tibble: 8 x 10
# Groups:   Week, AgeClass [2]
  Week    AgeClass vaccination_sta~    pop confirmed confirmed_tot  hosp hosp_tot
  <chr>   <chr>    <fct>             <int>     <int>         <int> <int>    <int>
1 2021-41 80+      Unknown          0            217          5568     1      904
2 2021-41 80+      Fully vac.       4.05e5        24           689    16      279
3 2021-41 80+      Partially vac.   7.14e3         0           154     0       58
4 2021-41 80+      Unvac.           4.33e4         8           918     6      701
5 2021-41 60-79    Unknown          0            597         27746     6     1674
6 2021-41 60-79    Fully vac.       1.44e6        34           969    10      270
7 2021-41 60-79    Partially vac.   3.62e4         1           236     2      105
8 2021-41 60-79    Unvac.           1.97e5        12          1930    18     1806
# ... with 2 more variables: deaths <int>, deaths_tot <int>
As of Today, (2021-10-20), the 4 last weeks considered are: 2021-38, 2021-39, 2021-40, 2021-41.
Where week 1, i.e. since BAG started collecting vaccination related figures, is the week from 2020/12/21 until 2020/12/27, while the data analyzed in this article span from 2021-09-12 to 2021-10-10.
We have also redefined the age categories as: 0-19, 20-39, 40-59, 60-79, 80+.
Last 4 weeks Cases and current Vaccination status
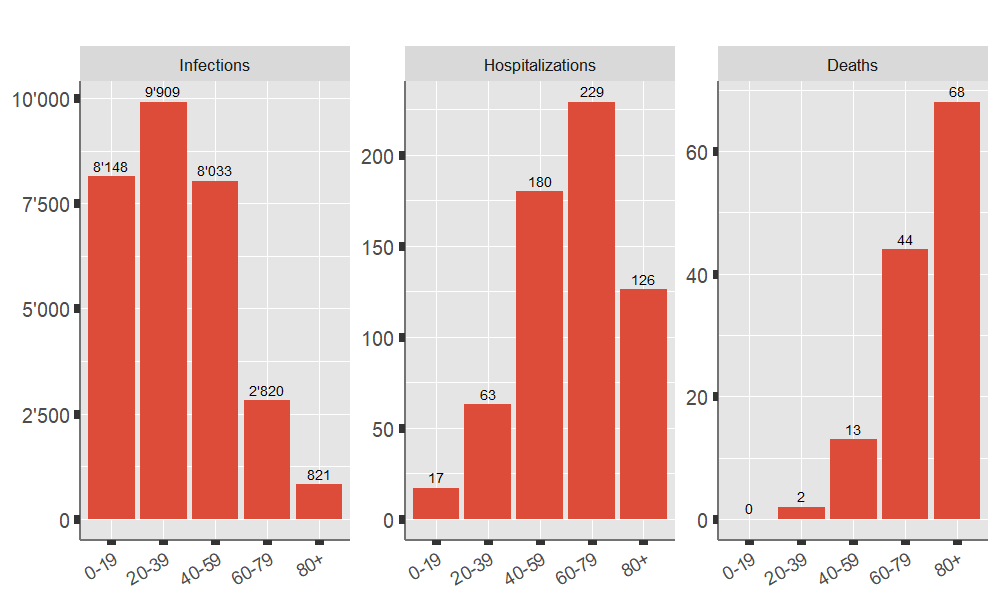
Before diving into the breakthrough cases, let’s first get an overview of the current picture, i.e. how the infections, the hospitalizations and deaths over the last 4 weeks are distributed across the age classes in absolute terms.
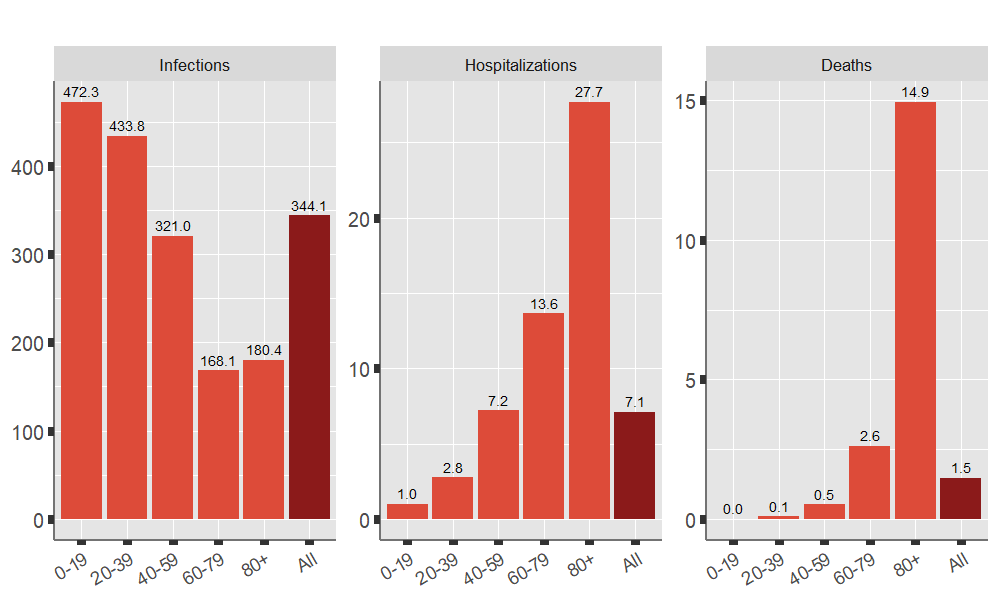
Let’s see also how the cases per 100’000 inhabitants are distributed in each age category:
Let’s also get a closer look at the vaccination status per age group, including the total without age split. As mentioned, we are showing the average vaccination across the last 4 weeks.
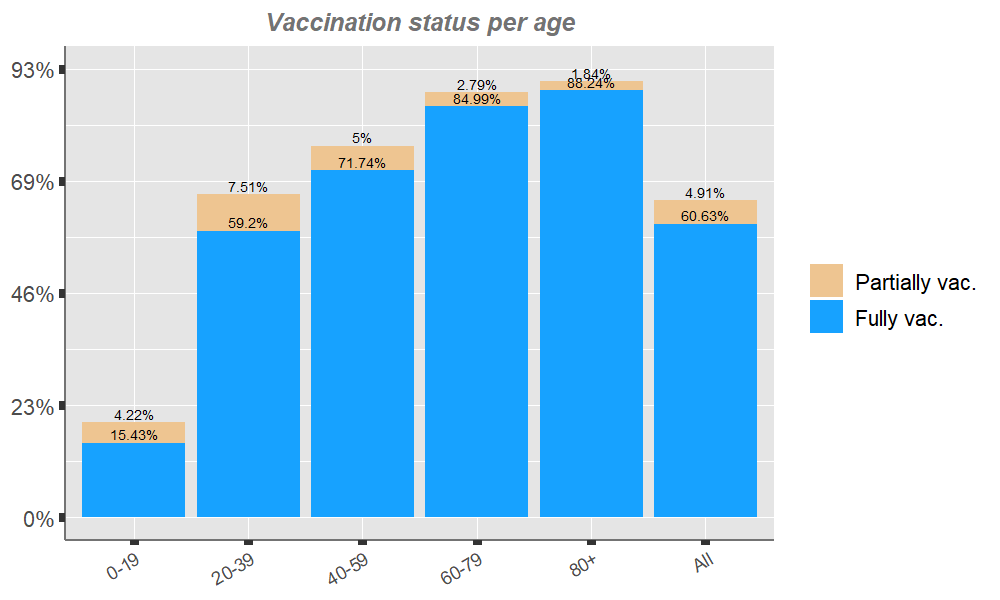
There is nothing new here so far, we observe what we know from having looked at the data for a longer period:
- Older age classes are more vaccinated.
- Confirmed infections per 100’000 people happen mainly in the younger ages thanks (also) to higher vaccination rates in older groups.
- Older people are more likely to die or to be hospitalized.
Last 4 weeks vaccination breakthrough cases
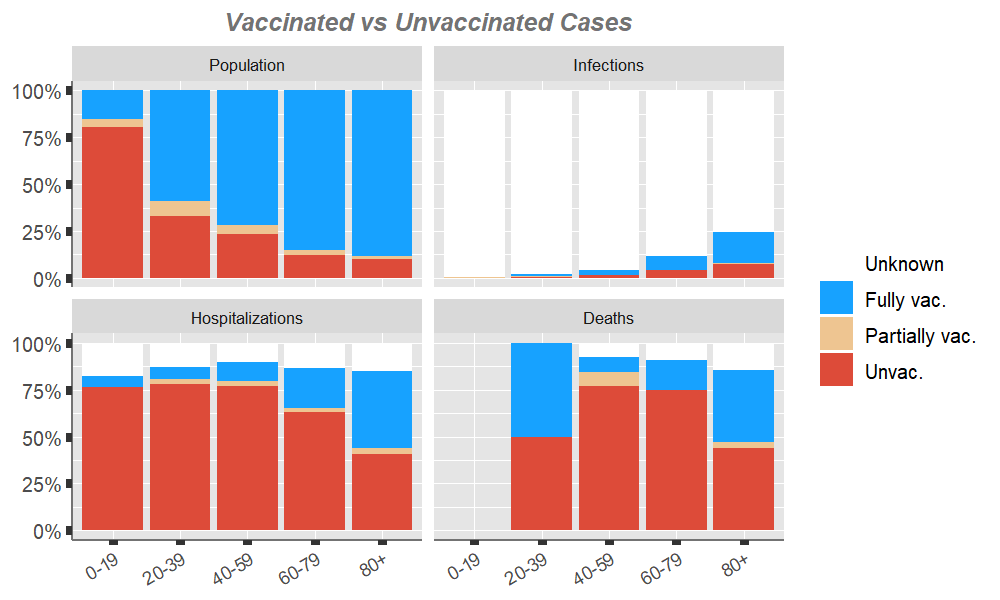
Thanks to the more detailed BAG data we are now able to check the number of cases across the various vaccination statuses, being aware that we have many falling into the “Unknown” class, especially among Infections. BAG is explaining that, test centers or pharmacies do not report to BAG any information on vaccination status, which is only listed in a clinical report mainly sent by doctors and hospitals.
| Table 1: absolute entries per age and vaccination status. (2021-09-12,2021-10-10) | |||||||||
| Population | Infections | ||||||||
|---|---|---|---|---|---|---|---|---|---|
| Unknown | Fully vac. | Partially vac. | Unvac. | Unknown | Fully vac. | Partially vac. | Unvac. | ||
| 0-19 | 0 | 266'212 | 72'861 | 1'386'101 | 8'109 | 18 | 7 | 14 | |
| 20-39 | 0 | 1'352'068 | 171'506 | 760'428 | 9'694 | 139 | 29 | 47 | |
| 40-59 | 0 | 1'795'543 | 125'240 | 581'950 | 7'674 | 225 | 24 | 110 | |
| 60-79 | 0 | 1'425'799 | 46'836 | 205'038 | 2'489 | 205 | 8 | 118 | |
| 80+ | 0 | 401'682 | 8'388 | 45'128 | 619 | 135 | 5 | 62 | |
| All | 0 | 5'241'304 | 424'832 | 2'978'644 | 28'598 | 722 | 73 | 351 | |
| Hospitalizations | Deaths | ||||||||
|---|---|---|---|---|---|---|---|---|---|
| Unknown | Fully vac. | Partially vac. | Unvac. | Unknown | Fully vac. | Partially vac. | Unvac. | ||
| 0-19 | 3 | 1 | 0 | 13 | 0 | 0 | 0 | 0 | |
| 20-39 | 8 | 4 | 2 | 49 | 0 | 1 | 0 | 1 | |
| 40-59 | 18 | 19 | 4 | 139 | 1 | 1 | 1 | 10 | |
| 60-79 | 31 | 49 | 5 | 144 | 4 | 7 | 0 | 33 | |
| 80+ | 19 | 52 | 4 | 51 | 10 | 26 | 2 | 30 | |
| All | 79 | 125 | 15 | 396 | 15 | 35 | 3 | 74 | |
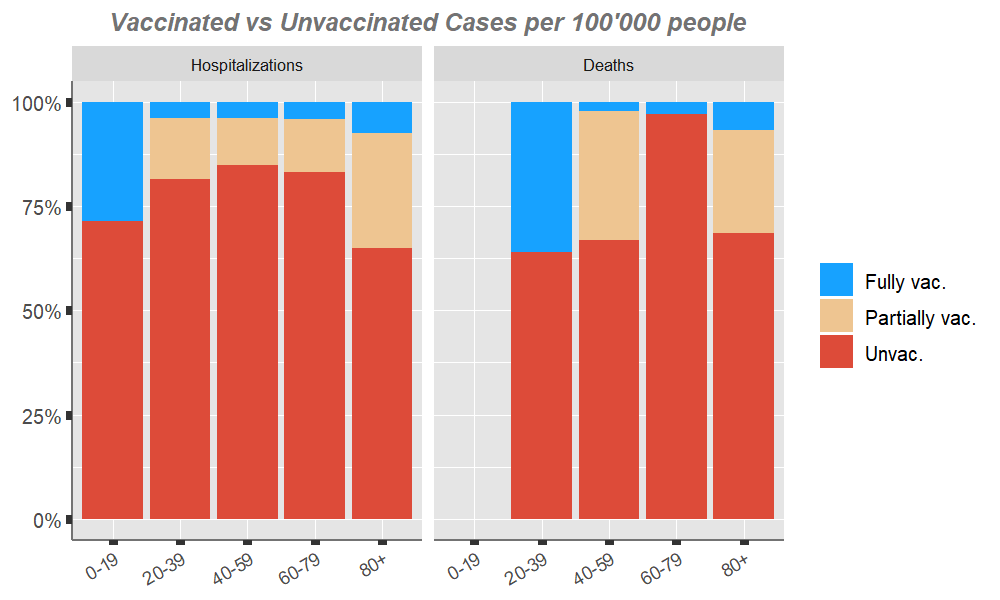
The majority of hospitalizations happen in the unvaccinated class, however, if we reduce the data to represent cases over 100’000 people in each reference age class, the impact of vaccination is much more apparent due to the fact that more than 50% of people are vaccinated in each class with the exception of the youngest, where luckily there aren’t many cases. It is worth looking only at the age classes higher than 39 where results can be more precise.
In this part we must remove the “unknown” vaccination status because we do not know the size of its reference population. This also means that all the figures presented over 100’000 people will be slightly underestimated in “Table 2”. Confirmed infections will not be considered any longer from now on.
| Table 2: entries over 100'000 people, per age and vaccination status. (2021-09-12,2021-10-10) | |||||||||||||||
| Hospitalizations | Deaths | ||||||||||||||
|---|---|---|---|---|---|---|---|---|---|---|---|---|---|---|---|
| Over 100k | Ratio over fully Vac. | Over 100k | Ratio over fully Vac. | ||||||||||||
| Fully vac. | Partially vac. | Unvac. | Fully vac. | Partially vac. | Unvac. | Fully vac. | Partially vac. | Unvac. | Fully vac. | Partially vac. | Unvac. | ||||
| 0-19 | 0.4 | 0 | 0.9 | 1 | 0 | 2.5 | 0 | 0 | 0 | ||||||
| 20-39 | 0.3 | 1.2 | 6.4 | 1 | 3.9 | 21.8 | 0.1 | 0 | 0.1 | 1 | 0 | 1.8 | |||
| 40-59 | 1.1 | 3.2 | 23.9 | 1 | 3 | 22.6 | 0.1 | 0.8 | 1.7 | 1 | 14.3 | 30.9 | |||
| 60-79 | 3.4 | 10.7 | 70.2 | 1 | 3.1 | 20.4 | 0.5 | 0 | 16.1 | 1 | 0 | 32.8 | |||
| 80+ | 12.9 | 47.7 | 113 | 1 | 3.7 | 8.7 | 6.5 | 23.8 | 66.5 | 1 | 3.7 | 10.3 | |||
| All | 2.4 | 3.5 | 13.3 | 1 | 1.5 | 5.6 | 0.7 | 0.7 | 2.5 | 1 | 1.1 | 3.7 | |||
Having a better look at the share of the Unknown vaccination status over the total we see that we have missed considering quite few hospitalized cases in “Table 2”.
| Table 3: % entries per age and vaccination status. (2021-09-12,2021-10-10) | |||||||||
| Hospitalizations | Deaths | ||||||||
|---|---|---|---|---|---|---|---|---|---|
| Unknown | Fully vac. | Partially vac. | Unvac. | Unknown | Fully vac. | Partially vac. | Unvac. | ||
| 0-19 | 17.6% | 5.9% | 0% | 76.5% | |||||
| 20-39 | 12.7% | 6.3% | 3.2% | 77.8% | 0% | 50% | 0% | 50% | |
| 40-59 | 10% | 10.6% | 2.2% | 77.2% | 7.7% | 7.7% | 7.7% | 76.9% | |
| 60-79 | 13.5% | 21.4% | 2.2% | 62.9% | 9.1% | 15.9% | 0% | 75% | |
| 80+ | 15.1% | 41.3% | 3.2% | 40.5% | 14.7% | 38.2% | 2.9% | 44.1% | |
| All | 12.8% | 20.3% | 2.4% | 64.4% | 11.8% | 27.6% | 2.4% | 58.3% | |
We can therefore rescale the cases of the three interesting vaccination categories, allocating the entries of the “Unknown” status to these three categories applying the same proportions. The table below with re-scaled values can be compared with “Table 1”.
| Table 4: entries per age and vaccination status. Reallocation of Unknown vaccination status. (2021-09-12,2021-10-10) | |||||||
| Hospitalizations | Deaths | ||||||
|---|---|---|---|---|---|---|---|
| Fully vac. | Partially vac. | Unvac. | Fully vac. | Partially vac. | Unvac. | ||
| 0-19 | 1 | 0 | 16 | ||||
| 20-39 | 5 | 2 | 56 | 1 | 0 | 1 | |
| 40-59 | 21 | 4 | 154 | 1 | 1 | 11 | |
| 60-79 | 57 | 6 | 167 | 8 | 0 | 36 | |
| 80+ | 61 | 5 | 60 | 30 | 2 | 35 | |
| All | 145 | 17 | 453 | 40 | 3 | 83 | |
Secondly, we recompute accordingly cases per 100’000 people in each vaccination status. These data will be used also in the following section. The table below with re-scaled values can be compared with “Table 2”.
| Table 5: entries over 100'000 people per age and vaccination status. Reallocation of Unknown vaccination status. (2021-09-12,2021-10-10) | |||||||||||||||
| Hospitalizations | Deaths | ||||||||||||||
|---|---|---|---|---|---|---|---|---|---|---|---|---|---|---|---|
| Over 100k | Ratio over fully Vac. | Over 100k | Ratio over fully Vac. | ||||||||||||
| Fully vac. | Partially vac. | Unvac. | Fully vac. | Partially vac. | Unvac. | Fully vac. | Partially vac. | Unvac. | Fully vac. | Partially vac. | Unvac. | ||||
| 0-19 | 0.5 | 0 | 1.1 | 1 | 0 | 2.5 | |||||||||
| 20-39 | 0.3 | 1.3 | 7.4 | 1 | 3.9 | 21.8 | 0.1 | 0 | 0.1 | 1 | 0 | 1.8 | |||
| 40-59 | 1.2 | 3.5 | 26.5 | 1 | 3 | 22.6 | 0.1 | 0.9 | 1.9 | 1 | 14.3 | 30.9 | |||
| 60-79 | 4 | 12.3 | 81.2 | 1 | 3.1 | 20.4 | 0.5 | 0 | 17.7 | 1 | 0 | 32.8 | |||
| 80+ | 15.2 | 56.2 | 133.1 | 1 | 3.7 | 8.7 | 7.6 | 28 | 77.9 | 1 | 3.7 | 10.3 | |||
| All | 2.8 | 4.1 | 15.2 | 1 | 1.5 | 5.5 | 0.8 | 0.8 | 2.8 | 1 | 1.1 | 3.6 | |||
Scenarios: (a) all vaccinated, (b) current status, (c) all unvaccinated
What if there had been no vaccination at all? Or if we were all vaccinated?
We can generate these opposite scenarios and compare them with the current situation of the last 4 weeks.
We can take the Hospitalizations and deaths rates over 100’000 people of the unvaccinated and vaccinated populations and project them over the full population.
We are aware here that:
- If there was no vaccination at all, then unvaccinated people would have worse figures as they would not benefit of the presence of a vaccinated population.
- On the contrary, we would have fewer cases among vaccinated (and hence hospitalizations and deaths) if the whole population had received a full protection.
Due to the entries with “unknown” vaccination status we would risk presenting underestimated figures for scenarios (a) and (c) because we would miss considering many cases. We use therefore the data with the reallocated “Unknown” entries from the previous section.
Having said that, this is again how cases per 100’000 people appear in the 3 scenarios:
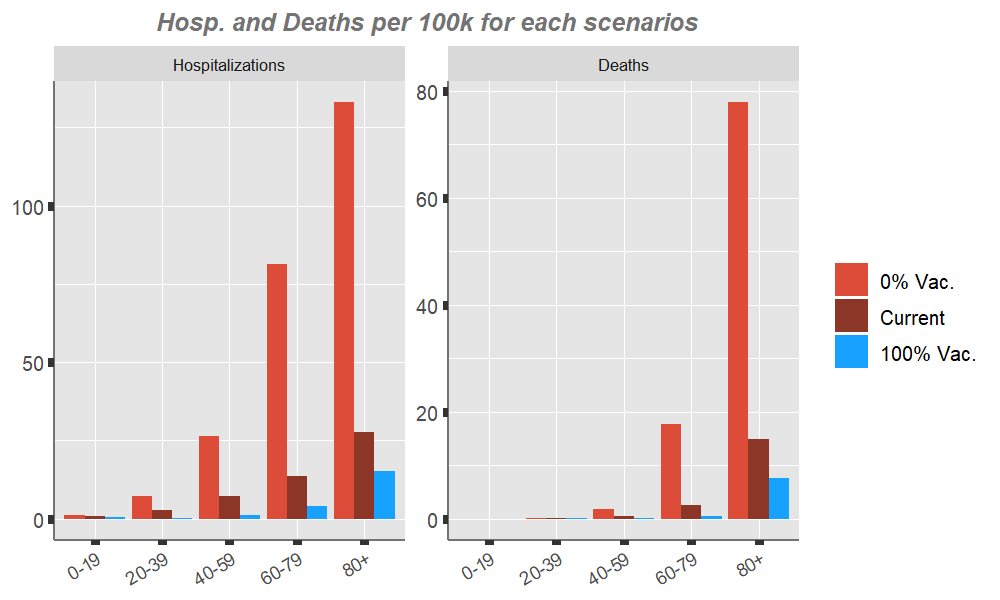
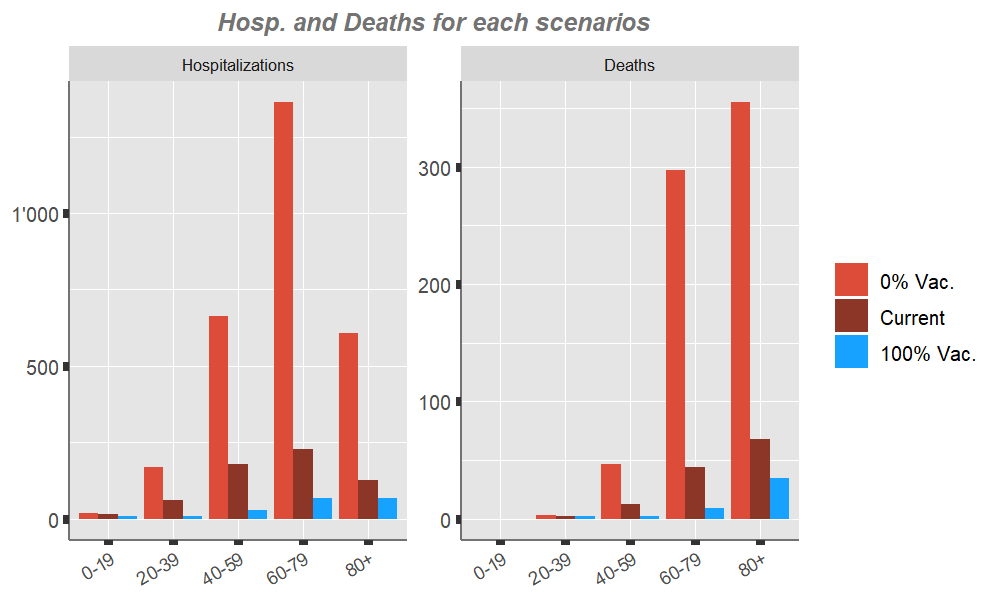
More importantly, projecting the values of the 3 scenarios on the whole population we can evaluate the vaccination impact in absolute terms. The 2 scenarios seem to differ remarkably from the current state:
| Table 6: Scenarios (a,b,c) per age and vaccination status. Reallocation of Unknown vaccination status. (2021-09-12,2021-10-10) | |||||||
| Hospitalizations | Deaths | ||||||
|---|---|---|---|---|---|---|---|
| 0% Vac. | Current | 100% Vac. | 0% Vac. | Current | 100% Vac. | ||
| 0-19 | 20 | 17 | 8 | 0 | |||
| 20-39 | 169 | 63 | 8 | 3 | 2 | 2 | |
| 40-59 | 664 | 180 | 29 | 47 | 13 | 2 | |
| 60-79 | 1363 | 229 | 67 | 297 | 44 | 9 | |
| 80+ | 606 | 126 | 69 | 355 | 68 | 35 | |
| Total | 2822 | 615 | 181 | 702 | 127 | 48 | |
The scenario of no vaccination at all would probably lead to having too many hospitalizations for the current capacity, and a lock-down due to the overload of hospitals could be inevitable.
Conclusions
It is pretty easy to read data from BAG in R thanks to available packages. Unfortunately the quality of the data is problematic (as often in data analytics), there are too many missing entries especially about Infections. It would have been very informative, for example, to check the percentage of Unvaccinated and Vaccinated people landing in hospital given an Infection.
Even with some deficiency in the data, our analysis clearly shows the benefits of vaccination, furthermore the scenario where nobody is vaccinated would make Switzerland fall again in an critical situation, while if we were all vaccinated we would possibly get out of the pandemic.
Confident in an improvement of the data quality as BAG states, we promise to propose this analysis again in few weeks time to check if anything changes. There could be a decay of the vaccination benefit over time for example, or the upcoming winter may also have an impact.
If you have any doubt about the results, any hint for improvement please do not hesitate to get in touch.
If you would like to learn how to do this yourself, how to manipulate data in R, visualize the results, and distribute it in a Shiny App, keep in mind our workshops about R and Shiny during October and November.

