

A year of Shiny development to continuously catch-up with the worldwide epidemic Covid-19.
Back in March a year ago, we were all hit by the fist wave of Covid-19, stupefied, confined at home and with wish of doing something for the community, and at the same time with the curiosity to know more ourselves about this situation.
As Miraiers, being neither nurses nor doctors, we could only help by staying at home and by doing what we know best: get insights out of data.
Everyone was eager to understand this unknown threat, data were being collected across the world and made available from multiple sources, starting from JHU. As an obvious step, Mirai started to develop a Shiny application, aimed at the general public in order to better capture the trends of the virus, its impact, and the differences across countries.
The Covid-19 app, at its early stage was presented at the CovidR initiative, an open-source pre-event contest of the e-Rum2020 conference. Since then the app has been enhanced to keep reflecting our concerns, knowledge and hopes.
Since last summer our data source became the global Covid19 DataHub project, a great work of data collection from all over the world, where new sources, including those at region level when available, have been added and updated continuously. We have crossed their data with others from the United Nations in order to group countries into continents and build macro areas within continents.
Bar charts comparing continents
Colorful bar charts can be found about different variables across the app from continent to regional levels.
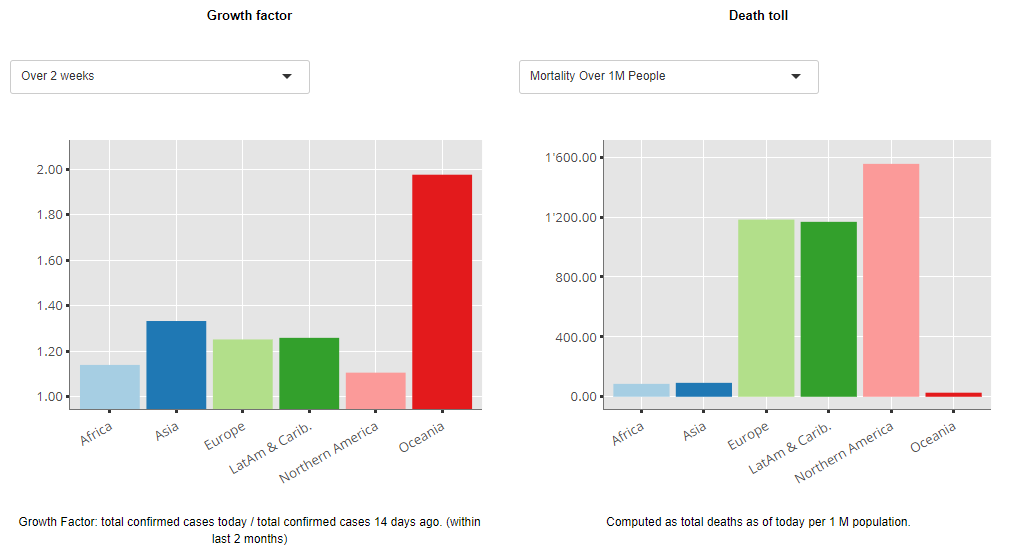
Covid-19 Bar charts about Growth Factor and Death toll on Continent tab
The new data source helped us slice the data, proposing a set of interactive visualizations at different layers, a web interface organized in several tabs that allow the users to dig down from the world overview to the deeper insights of the continents, their countries and their regions.
Global and regional Maps
We loved leaflet from the start: what a tool to show the geographic split of the continent into areas and the distribution of the spread!
Continents and Swiss heat-maps are used to show some of most important variables at different layer:
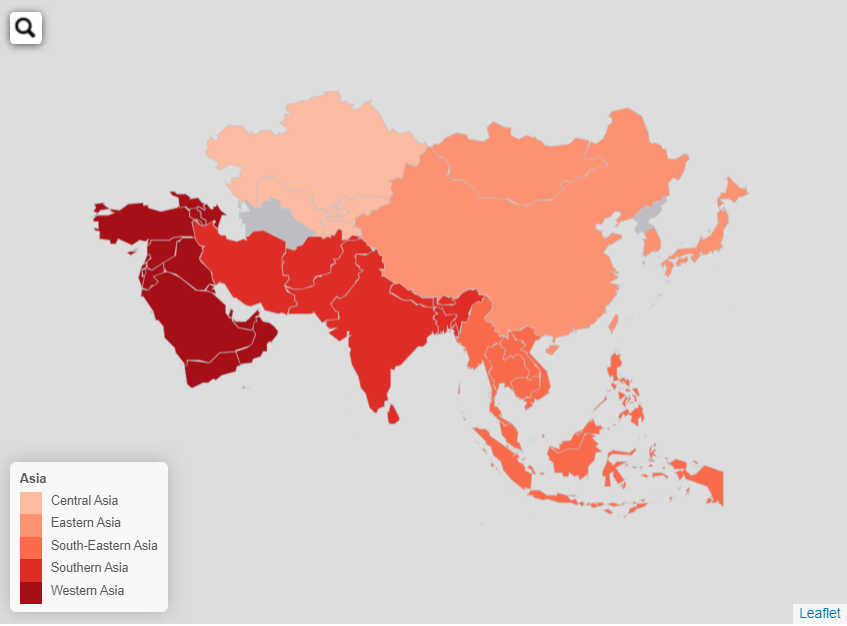
Covid-19 Asia Map Confirmed Cases
Scatter Plot of Countries comparison
Being an international team, we appreciated already in the first version of the app to be able to compare how countries were facing the pandemic.
Those countries having already high impact while being in a steep growth were often in the spotlight of the media and had to suffer harder lock-down especially in the first wave.
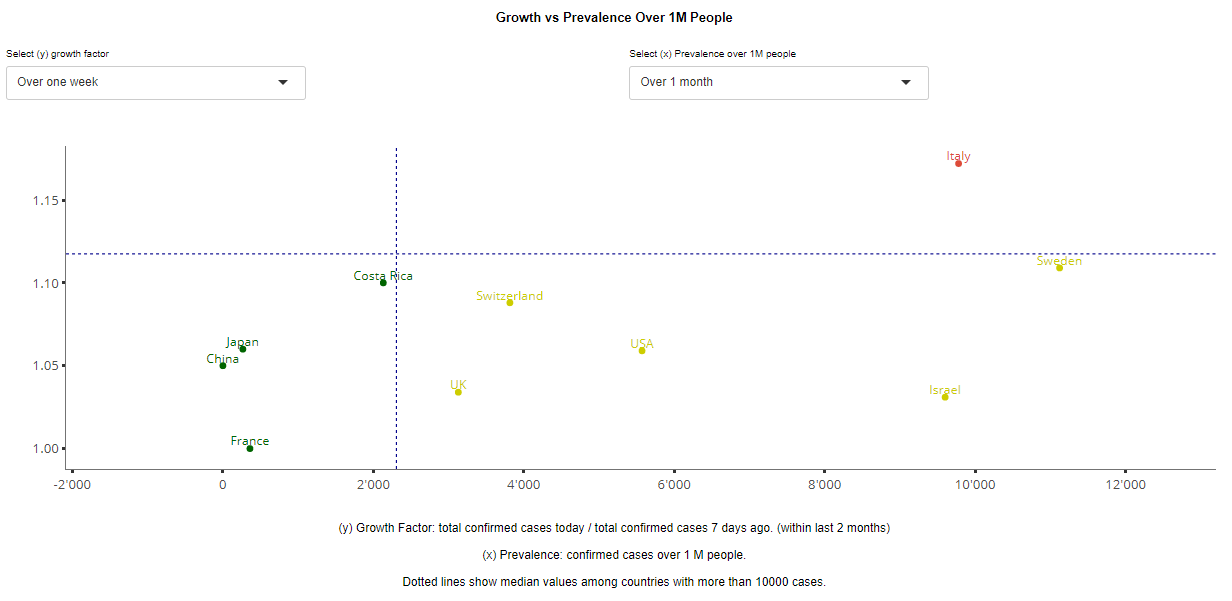
Covid-19 Comparison of 10 selected countries: Growth vs Prevalence over 1M people
Being Zurich based and confronted every day with the data and news coming from the BAG, a focus on Switzerland on its own became a must for us at some point of the journey. We even created a special tab for Switzerland.
Hospitalization Graphs
While data collection improved, adding the hospitalization figures enabled a differentiated understanding of the virus impact and risk.
The various waves across times could be better compared looking at the load they caused on hospitals, where the second wave had often a higher peak in the western world. This was due to its major strength, but also because many countries (unfortunately not all) were able to increase their hosting capacity after the first wave thanks to the efforts made to improve hospitals and to provide additional hosting facilities.
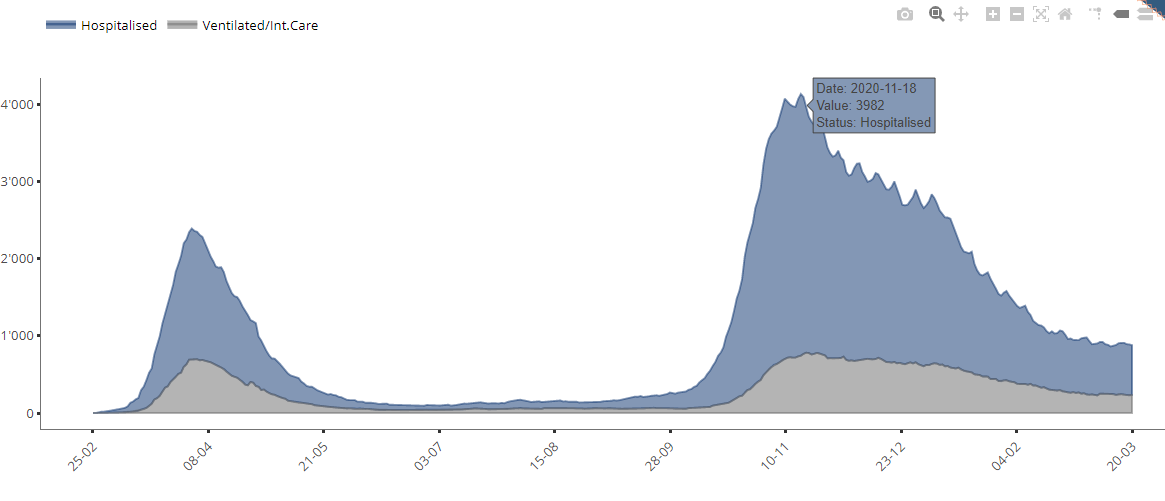
Covid-19 Swiss hospitalization
Literal reporting of vaccination
Finally a light at the end of the tunnel! Who is not curious nowadays to track closely the progression of the vaccination across the globe? For such purpose, we implemented dynamic value-boxes showing the current accurate figures as you open the app, and lately included a textual graph that gives you an insight of the vaccination campaign, putting in relation the current vaccination pace with and a chosen target date.
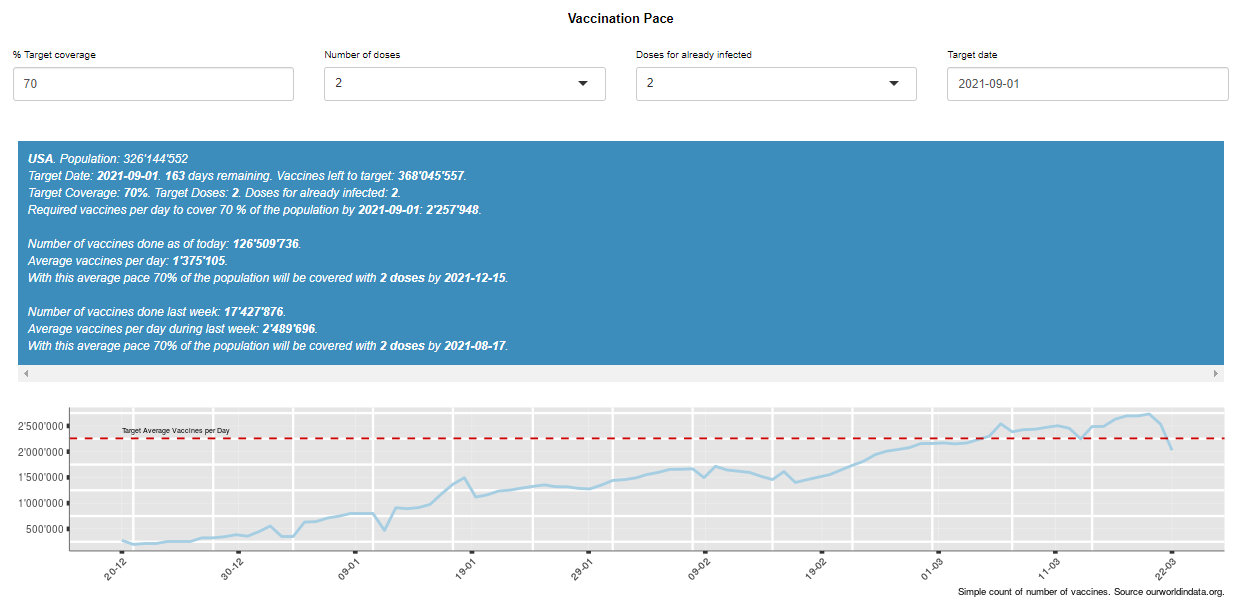
Covid-19 USA vaccination forecast vs target
If the few above examples raised your interest and curiosity, we invite you to try out our app and browse it yourself to search and get the report of your interest. Since it’s an open source project, you’re welcome to contribute or to give your feedback and suggestions.
Stay stunned and stay healthy!
Hoping to see most of numbers converging to zero soon, we will do our best to keep the app up to date in the next months, data size is growing with time and scalability, like having many concurrent users, can be an issue we are aware of.
Suggested reading: